

Steady Improvement at the Halfway Mark of 2024
The summer is now in full swing, and the first half of 2024 is already in the books. Multifamily performance trends stabilized somewhat last year after a highly volatile period from 2020 through 2022. So far, 2024 has largely continued along anticipated trajectories.
In broad strokes, this year has seen continued year-over-year improvement in apartment demand from the trough of 2022, but the improvement has not been enough to offset new supply. The result has been downward pressure on both average occupancy and average affective rent growth while lease concession availability has consistently risen.
All numbers will refer to conventional properties of at least 50 units.
View the full monthly Markets Stats PDF
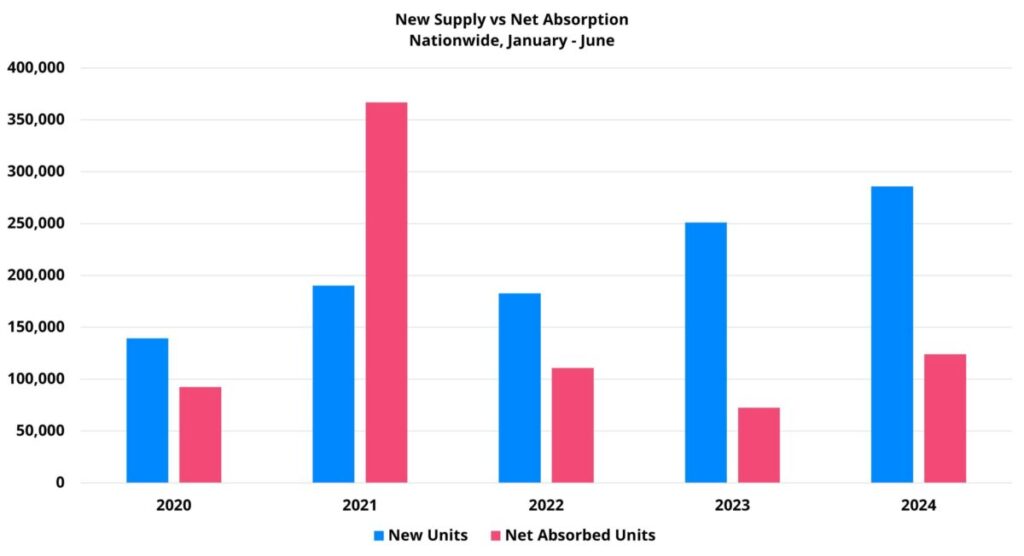
New Supply and Net Absorption
Approximately 286,000 new units were delivered nationally in the first six months of this year. This was 14% higher than in the same portion of last year and higher than in any other recent year by much wider margins. In fact, as recently as 2017, annual deliveries were lower than this year’s total for just the first half of the year.
The markets at the top of the list for new units so far this year have mostly been the usual suspects, but there have been some notable changes. Dallas – Fort Worth continued to lead the way with more than 20,000 new units delivered this year through June. New York and Atlanta rounded out the top three with just over 14,000 new units each. Other areas of note were Denver – Colorado Springs and Austin with about 11,800 and 11,200 new units introduced, respectively.
Markets like Austin, Houston, Charlotte, Raleigh – Durham, and the major Florida markets which were at the forefront of the construction boom in recent years all remain in the top twenty for market-level deliveries through June. However, they were all lower in the rankings than they would have been one or two years ago.
Net absorption of about 124,000 units in the first half of the year was 71% higher than in the same portion of 2023. This year’s apartment demand through June was the highest since 2021. Still, it remained below the pre-pandemic average of around 204,000 units in the first half of the year for the 2017 through 2019 period.
Encouragingly, the most substantial year-over-year improvement came in the Class C and Class D price classes. While the top two price tiers managed small gains in net absorption, Class C saw an improvement of more than 20,000 net units and Class D net absorption rose by about 27,000 units.
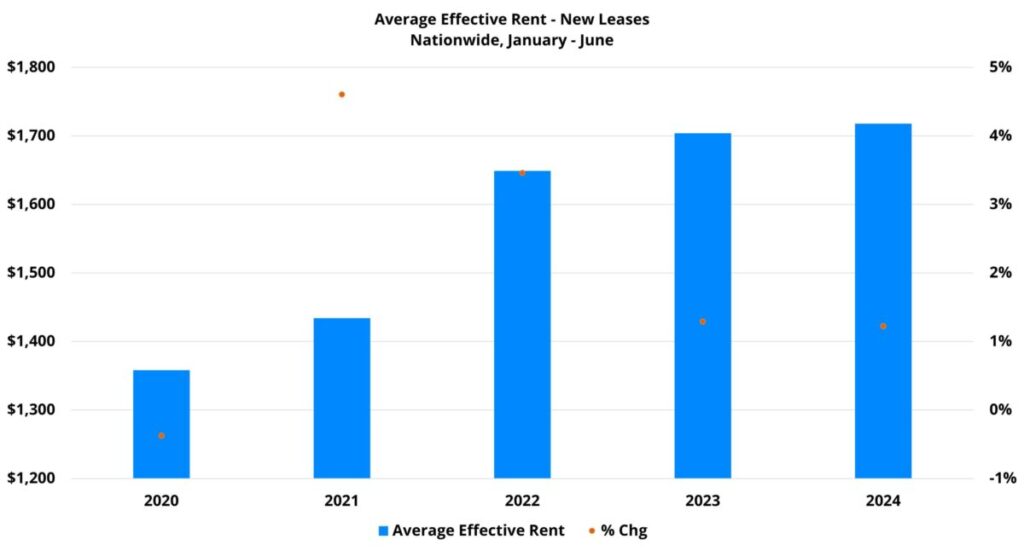
Average Effective Rent
Progress on the national apartment demand front did come at the expense of rent growth, but not dramatically so. Average effective rent for new leases increased 1.5% in the first half of the year to close June at $1,718 per month. This year’s rent growth has been the lowest since 2020. This year was also the third time in the last five years that average effective rent growth for new leases failed to reach 2% through June – a threshold that was consistently met in the years immediately prior to 2020.
Leaders in rent growth so far this year have tended to be outlying areas of states that are not included in any metropolitan statistical areas (MSAs) such as in Montana, Missouri and Wyoming as well as small markets. Areas like Green Bay, WI, Moline, IL, and Beaumont, TX each managed to add just more than 5% to their average effective rent in the period.
Among larger markets, there was a clear regional skew. The Buffalo – Syracuse area led the way with a 4% average effective rent gain for new leases through June. The next five markets were all in the Midwest: Cleveland – Akron (4%), Chicago (3.3%), Columbus (3.1%), Cincinnati – Dayton (2.7%) and Indianapolis (2.7%).
The story with the market leaders in rent growth this year has been more to do with less new supply than especially high demand. None of the top ten markets met or exceeded the size-adjusted national average for new supply and only half met or exceeded the size-adjusted national average for net absorption.
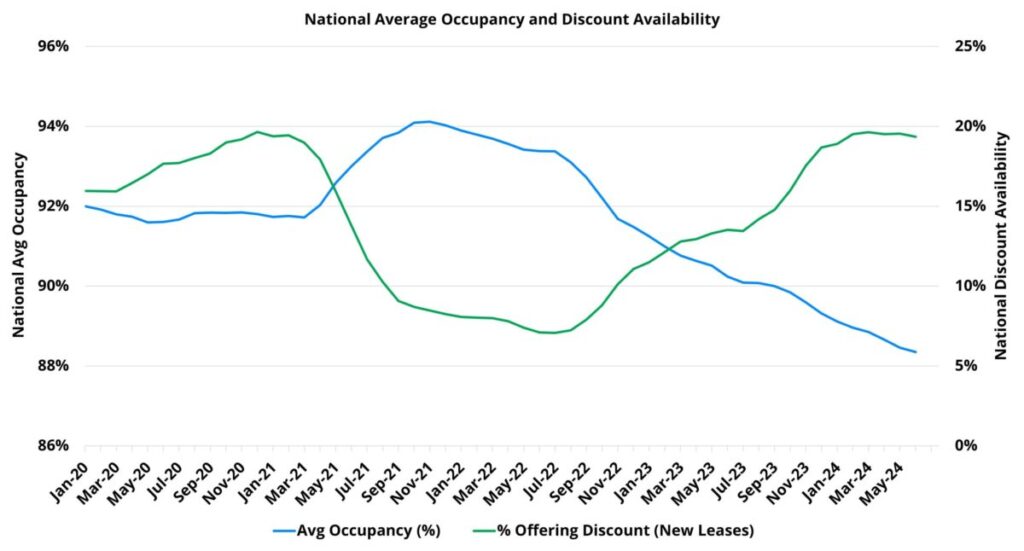
Average Occupancy and Lease Concessions
National average occupancy has remained on the downward track it has been on since late 2021 – and this is very unlikely to change for the remainder of 2024. Even so, a 1.1% decline in occupancy in the first two quarters was smaller than last year’s 1.3% drop in the same portion of the calendar thanks to a larger uptick in demand than in new supply. Overall national average occupancy finished June at its lowest point in years at just over 88%. For properties that entered 2024 already stabilized, mid-year average occupancy was 93% – also down considerably from its peak a few years ago.
Average occupancy has a better chance to return to positive territory next year if apartment demand can maintain its momentum long enough to take advantage of the eventual slowdown. Though still robust, new supply should begin to wane in 2026 and be a less prominent component of the 2027 multifamily environment.
The upward momentum in lease concession availability has slowed so far this year, but June did end with a higher rate of availability than was the case to begin the year. Approximately 20% of conventional properties ended the period offering a discount for new residents. Discount availability this year has remained consistent in recent months and continues to match the peak of the pandemic period which occurred in the final quarter of 2020. Concession availability is likely to surpass that of the pandemic-era peak during the fourth quarter of this year.
Takeaways
2024 has played out according to expectations so far. The tail end of a construction boom that began in the latter half of last decade has continued to pressure occupancy and rent growth despite sustained improvement in demand. The new construction pipeline will not be slowing in the second half of the year, so the broad strokes of these dynamics are expected to remain intact over the next six months.
Challenges remain: the job market has shown signs of softening, inflation remains stubborn, economic growth generally slows in presidential election years, the geo-political picture remains uncertain, and the strongest portion of the year for apartment demand is soon coming to an end.
However, industry performance so far this year has provided some reasons for optimism as well. Most obviously, the net absorption improvement that began last year has continued, and strengthened, so far in 2024. A shortfall remains relative to the pre-pandemic average, but apartment demand has now been steadily improving for eighteen months.
Furthermore, the most robust improvement in demand has come from the workforce housing segments. Poor net absorption outside the top of the market was a drag on national absorption in 2022 and in 2023. Notable improvement there was a welcome sight, and one that industry observers have been watching for.
Another reason for optimism is that the increased demand has not required negative rent growth. Average effective rent growth remains lower than normal, but considering the larger context, any gain this year is something of a victory. The challenge will be to end the year with an annual gain intact.
Why choose ALN for Budget Season?
Our flagship platform’s roots go back to 1996 when we were among the first research firms to digitally provide data in the multifamily industry. Since then, we’ve helped countless multifamily professionals transform their budget season from a daunting task to an opportunity for growth and optimization.
Disclaimer: All content and information within this article is for informational purposes only. ALN Apartment Data makes no representation as to the accuracy or completeness of any information in this or any other article posted on this site or found by following any link on this site. The owner will not be held liable for any losses, injuries, or damages from the display or use of this information. All content and information in this article may be shared provided a link to the article or website is included in the shared content.