

Positive Rent Growth in a Majority of Markets
From September of 2023 through January of this year, national monthly effective rent growth for new leases was negative. Rent growth finally returned to the positive in February. Monthly change in February was more of a lateral move with average effective rent gaining less than 0.1%, but the monthly negative streak nonetheless came to an end.
Encouragingly, the improvement in rent performance so far in 2024 has not been an isolated phenomenon within just a handful of markets. 84 markets around the country have managed some level of average effective rent growth so far this year, with another dozen markets remaining unchanged at the average. For those areas that have continued to lose ground, only a handful have seen a slide of more than 1% in the opening two months of 2024.
All numbers will refer to conventional properties of at least 50 units.
View the full monthly Markets Stats PDF
New Supply Has Played a Role
There were a few exceptions, but for the most part those markets with positive rent performance so far this year have not been among those will major deliveries in the period. In fact, many of the markets have not seen high levels of new supply in recent months even prior to 2024. The subsequent higher average occupancies have been a boon to rent growth.
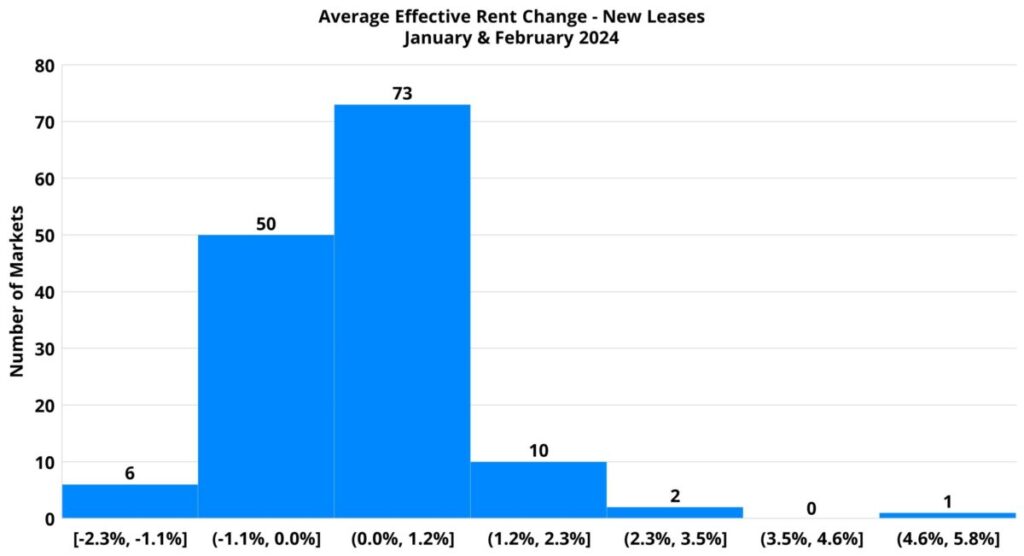
In Columbia, Missouri average effective rent for new leases rose 5.8% in the first two months of the year. The market had no new units delivered in that time and average occupancy closed February at 95%. Rent growth there has more than doubled that of any other market. A similar dynamic has played out in other small markets near the top of the rent growth list such as Beaumont, Texas, Evansville, Indiana, and Victoria, Texas. Each has added between 1% and 2% to their average effective rent in the period with average occupancy above the national average and no new supply so far this year.
There were markets in which rent growth came alongside notable new supply. Myrtle Beach, South Carolina saw the introduction of more than a dozen new properties comprised of about 2,800 units in the first two months of the year – equal to nearly 15% of existing conventional stock. For context, the average market added new units equivalent to 0.5% of existing stock in the period. So many new units, and with the average monthly effective rent of lease-up properties $200 higher than the average for stabilized properties, the market-level average effective rent rose by 2.4% to start 2024.
Similarly, the Savannah, Georgia market added more than 1,000 new units to start the year – new supply equal to 2.3% of existing conventional stock. Average effective rent for new leases rose by 1.3% in the period with the aid of new units entering the market well above the price point of properties that were already stabilized prior to 2024.
Sunbelt Primary Markets Have Struggled
One aspect of recent rent performance data that jumped off the screen amongst the large markets was that none managed to add even 1% to the average effective rent in the opening two months of the year. Another was the geographic difference in performance. Of the top ten primary markets for average effective rent growth to begin 2024, none were Sunbelt markets. Three Ohio markets cracked the top ten: Cleveland – Akron (0.9%), Columbus (0.7%) and Cincinnati – Dayton (0.3%). Indianapolis led the way with a 0.9% gain, edging out Cleveland – Akron slightly despite the same rounded value.
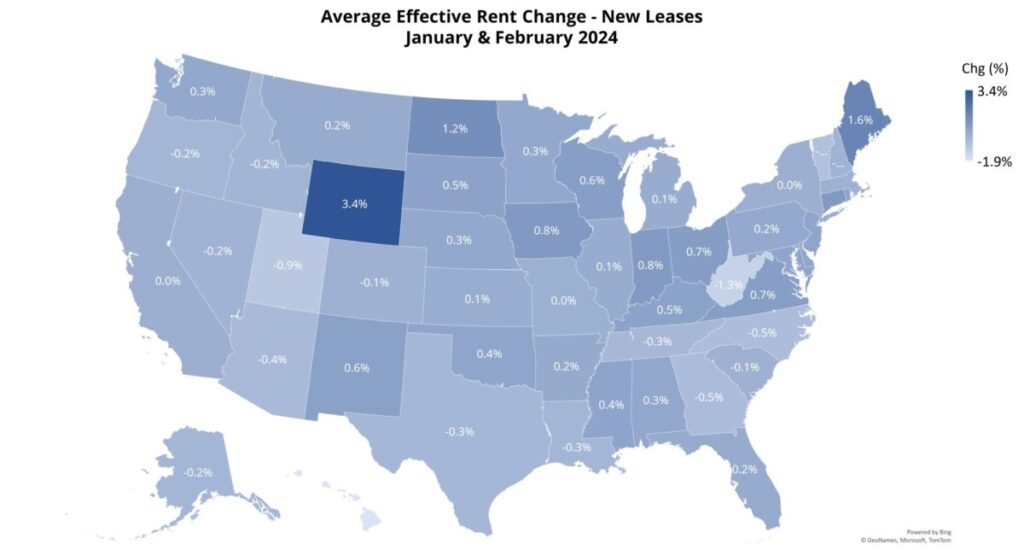
On the other end of the spectrum, Sunbelt markets accounted for all but one of the bottom ten performers at the market level. The good news was that the declines in the period were as small as the increases for the top performers. No market lost 1% on the average. Charlotte and Dallas – Fort Worth led the way with a decline of 0.7% in each. Atlanta, Austin, Nashville, and Raleigh – Durham each suffered a loss of between 0.5% and 0.6% in average effective rent. San Antonio (-0.4%), Phoenix (-0.4%), San Diego (-0.3%), and Kansas City (-0.3%) rounded out the bottom ten.
Most of these primary markets that have lost ground in average effective rent so far this year have been at the forefront of the multifamily construction boom in recent years – and have the average occupancy to match. Of the bottom ten markets, only San Diego and Kansas City closed February with average occupancy above the national average of 12%. Those two markets, along with Nashville, have seen a net loss of leased units to open 2024.
Areas like Charlotte, Austin, and San Antonio have seen above-average demand so far this year, but net absorption has not kept pace with deliveries.
Takeaways
After a rough finish to 2023, multifamily rent performance appears to have turned the corner, for now. Only about one-third of markets around the country continued to lose ground in the first two months of the new year. Of those markets, only six saw the average effective rent for new leases slide by 1% or more.
With the spring and summer periods now immediately ahead, further apartment demand and rent growth improvement should be on the way. However, not all is roses and sunshine for 2024. National average occupancy is at its lowest point in more than a decade, and many markets around the country have not yet seen the bottom for occupancy. Pressure from the new construction pipeline will continue to play a prominent role in industry performance this year and next even if the trend of improving apartment demand that began last year continues unabated.
However, at least until the back half of 2024, the rent declines of recent months should be in the rearview mirror for most markets.
Unlock Your Multifamily Data Potential Now!
Dive into the most comprehensive multifamily database with ALN Apartment Data and access detailed, actionable data on properties nationwide.
Disclaimer: All content and information within this article is for informational purposes only. ALN Apartment Data makes no representation as to the accuracy or completeness of any information in this or any other article posted on this site or found by following any link on this site. The owner will not be held liable for any losses, injuries, or damages from the display or use of this information. All content and information in this article may be shared provided a link to the article or website is included in the shared content.