Rent Growth Has Decoupled from Apartment Demand
As was first discussed in the ALN newsletter for February, the incredible apartment demand that fueled 15% national average effective rent growth last year did not survive the turn of the calendar to 2022. Despite that, rent growth has persisted at a torrid pace through the first four months of this year.
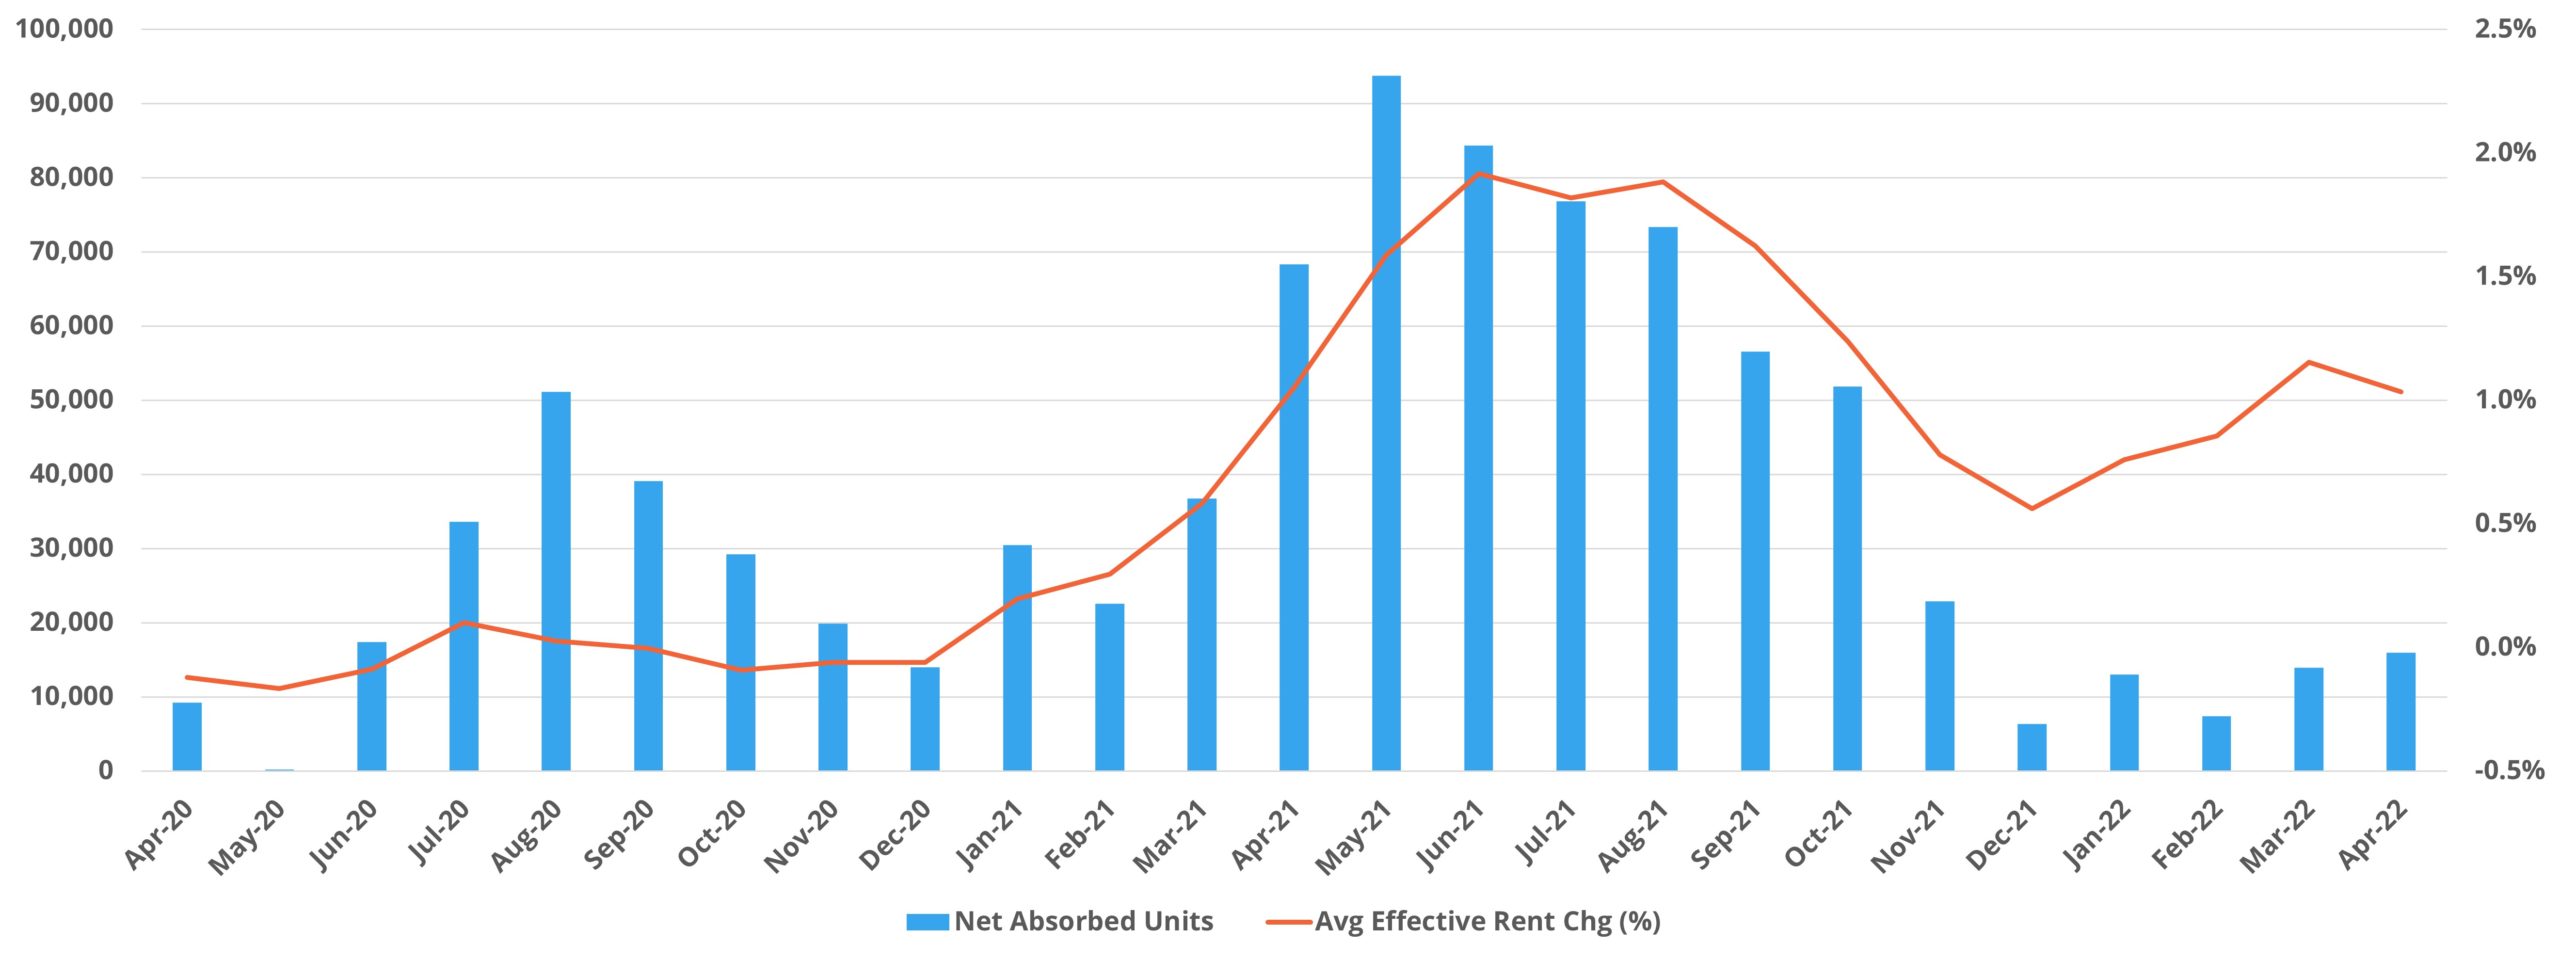
The extent to which this change in dynamic can be observed in multifamily data depends on the time period being evaluated. Headlines that continue to tout the continuation of strong apartment demand point to net absorption for a 12-month rolling period. And yet, the bulk of the absorption picked up in that metric occurred from April through November of 2021. When evaluating the environment based on monthly data or year-to-date data, the picture changes significantly.
Because this dichotomy was the topic of a recent blog post, the focus for this month’s newsletter will be a broad review of the current macroeconomic picture and then a closer look at recent rent growth for the industry.
As a reminder, all multifamily numbers refer to conventional properties of at least 50 units. Employment and economic data was sourced from the US Bureau of Labor Statistics.
View the full monthly Markets Stats PDF
National Labor Force and Unemployment
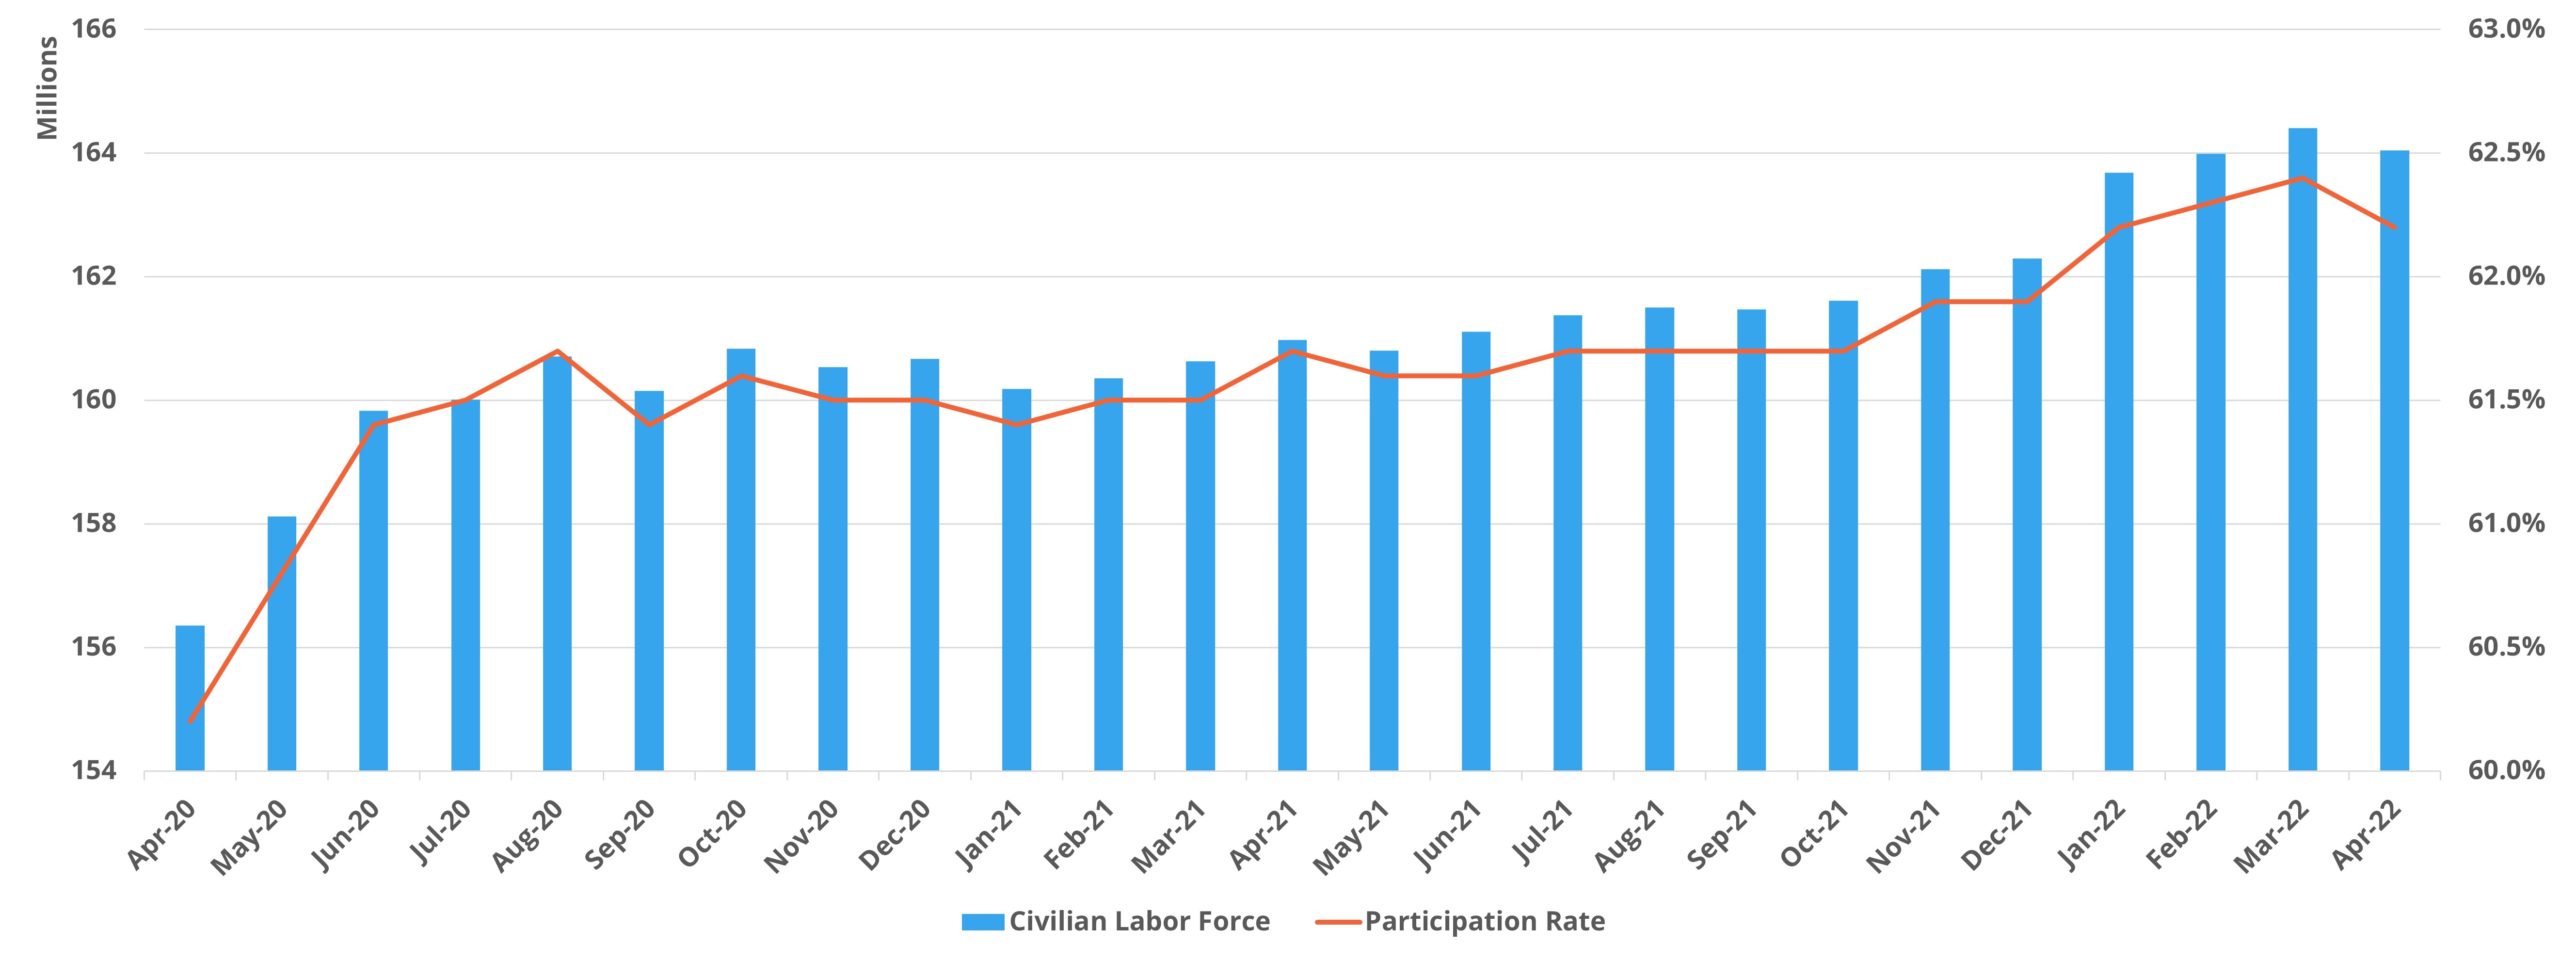
The civilian labor force closed April at just over 164 million participants in size, second only to the March total since the onset of the COVID-19 pandemic two years ago. The labor force participation rate ended the same month at 62.2%. This was down slightly from February and March but was higher than any month in 2021. For the second consecutive month the national unemployment rate stood at 3.6% at the end of April. This unemployment rate for March and April represented the lowest value of the last two years and was a far cry from the 14.7% rate from April of 2020 in the early days of the pandemic.
All of these metrics paint a positive picture, but one blip in the April data is worth pointing out. As already mentioned, the size of the national labor force contracted in April. This development was the reason fewer people were employed in April than in March even as the unemployment rate remained at 3.6%.

In five other months out of the last 24, the size of the US labor force has decreased despite the entire 24-month period constituting a recovery from the initial economic shock of the pandemic and the response measures to it. April of 2022 becoming the sixth month in that group did not make at an outlier then. However, the April decline of more than 360,000 labor force participants was larger than the two most recent monthly declines combined, was the largest since January of 2021, and was the third largest of the six monthly declines over the last two years. In three of the previous five instances, the month following the decline brought a gain larger than the decrease itself – so the May data will be instructive.
Inflation
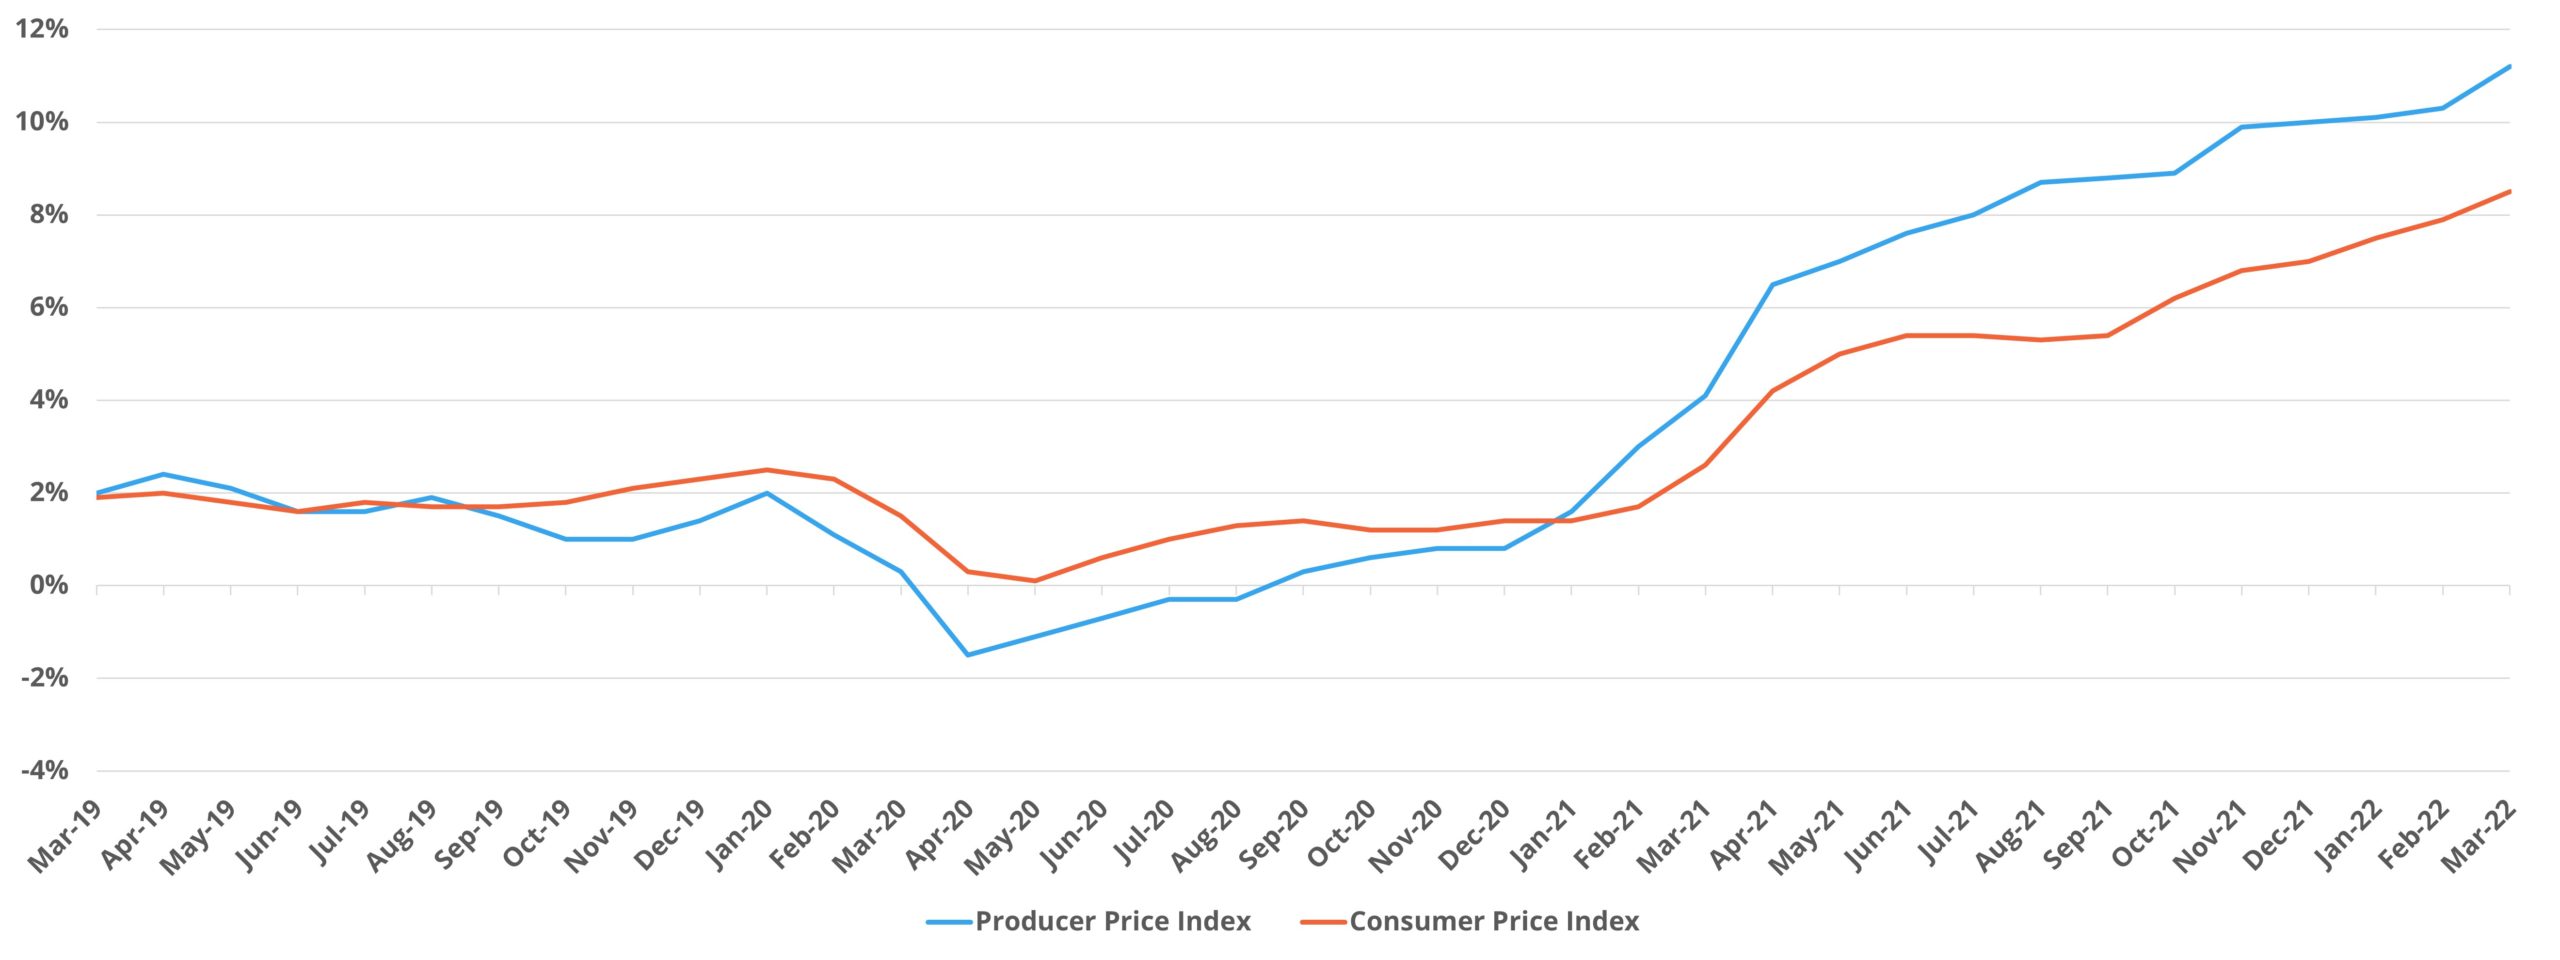
Inflation continues to be a major story and a growing concern for the macroeconomic situation in general. Two very well-known indices are useful here – the Producer Price Index (PPI) and the Consumer Price Index (CPI). The PPI measures inflation in costs for producers of goods. The CPI measures inflation in goods and services that are purchased by households. The PPI is generally a leading indicator of CPI movement because increased costs for producers get passed on to consumers via higher prices. The indices are reported monthly, and each monthly value represents inflation for the 12-month period ending in that month.
PPI inflation began in earnest in February of 2021, moving from 1.6% in the previous month to 3% in February. Inflation has steadily risen in each month since, and the PPI closed March of 2022 at 11.2%. Below the headline number, some subcategories were much higher. Energy closed March up 37% over the last 12 months, and the Transportation and Warehousing category clocked in at 21%.

For the CPI, inflation really began to take off in April of 2021 after an uptick in March. A 2.6% result in March was followed by 4.2% in April of last year. Like the PPI, consumer-side inflation has steadily grown in the time since, and March closed with a value of 8.5%. The top line number obscures some specific pain points. The general Energy category rose 32% in the last 12 months. Gasoline increased by 48% in that same period and piped natural gas has gained 21%. Aside from those, electricity, new cars, and groceries have all gained at least 10% over the last year as well.
One way to illustrate the effect of inflation on consumer purchasing power is to compare nominal average hourly earnings to real average hourly earnings. For the 12 months ending in March of 2022, nominal (non-inflation adjusted) average hourly earnings rose by 5.5%. In the same period, real (inflation adjusted) average hourly earnings declined by 2.4%.
National Rent Growth
From April through October of last year, monthly average effective rent growth for the US was above 1% for each month. After a slight cool down from November through February of this year, monthly average rent once again was above 1% for both March and April. As previously mentioned, this renewed momentum in rent growth was despite a continued and increasing decline in apartment demand. Through the first four months of this year, average effective rent was up 3.9% even with the lowest net absorption of the last five years for this portion of the calendar and a nearly 70% decline in demand compared to last year.

Notably, rent growth has been much stronger this year than in the same period of any recent year across all price classes, across markets of different sizes, and across the urban-suburban-outlying divide. The broad-based nature of these results bears a resemblance to last year, of course, without the generational demand that helped propel those results in 2021.
From a price class perspective, rent growth has been strongest in the top two price classes. Class A and Class B have both added more than 4% at the average, led by a 4.4% gain for Class A. The 2.5% appreciation in Class D was the ‘weakest’ result of the four price classes.
The highest year-to-date rent growth of any subset across the aforementioned categories was a 4.7% increase for ALN Tier Two markets. ALN assigns each market to one of four tiers based on the quantity of multifamily stock in the market. Tier Two markets can roughly be characterized as secondary markets for multifamily. This group saw the largest average rent increase through April thanks to its Florida markets. Fort Lauderdale and Miami each added more than 7% at the average and Palm Beach gained just over 6% in average effective rent.
Takeaways
For the sake of space, a more detailed look at a few notable markets will be the subject of upcoming ALN blog posts. Other issues like rising interest rates, the sustained shortage of single-family homes, and the recent shift in demand on the single-family side as a result of these factors could also have been addressed.
In terms of the macroeconomic picture, it’s clear that 2022 will be more of a challenge than 2021. The labor market remains tight, but the next couple of months will illuminate whether the relatively large monthly decline in the size of the labor force in April will be a blip or the start of a larger trend. Inflation has become a larger and larger problem over the last year and there is not much reason to think its trajectory will change in the near term. In fact, the March gain in the Producer Price Index was the largest since November of 2021 and as mentioned already, acts as a leading indicator for the Consumer Price Index.
In the face of growing headwinds from outside the industry and apartment demand that has been on the decline for almost six months now, national average effective rent growth has regained some steam in recent months. The fact that national average occupancy remains higher than normal is relevant, but so too is the fact that occupancy has been on the decline since November – so far without the usual Spring bounce and with evictions on the rise.
Demand and rent growth cannot be decoupled into perpetuity, and it seems as though a confluence of factors may well begin taking the wind out of the rent growth sails in the coming months absent reinvigorated summer apartment demand and macroeconomic improvement.
Ready for Budget Season?
Budget season can be stressful enough, so let our research team work for you! With over 30 years of experience and nationwide availability, ALN Apartment Data has the methodology, coverage, depth, pricing options and client support you need.

Disclaimer: All content and information within this article is for informational purposes only. ALN Apartment Data makes no representation as to the accuracy or completeness of any information in this or any other article posted on this site or found by following any link on this site. The owner will not be held liable for any losses, injuries, or damages from the display or use of this information. All content and information in this article may be shared provided a link to the article or website is included in the shared content.

