Q3 Brought an End to Coasting on 2021 Multifamily Demand
The multifamily industry managed to ride the wave of an historic 2021 all the way through the first half of this year. Average occupancy remained higher than in the immediate pre-COVID period thanks to last year’s significant jump in occupancy. This leftover cushion allowed rent growth momentum to continue into the summer of 2022 even as national occupancy trended down from its peak in November 2021 and even as national apartment demand was dramatically lower than usual.
The downward shift that finally occurred in rent growth did not really materialize until Q3 2022, and this change was arguably the most consequential development in the quarter. For all of the attention that apartment demand has been getting in the last two weeks or so since quarterly data began to be available for the third quarter, it has been clear for months now that the situation had shifted enormously from 2021.
View the full monthly Markets Stats PDF
Part of the reason this change took a little longer to be widely reported was a propensity to focus on 12-month data. For much of 2022, the historic results of 2021 were skewing the 12-month data and obscuring the story that was apparent in the monthly and quarterly numbers. Now that nine months of 2022 data is available, and only Q4 2021 is included in 12-month data, the 2021 skew has been minimized.
New Supply and Net Absorption
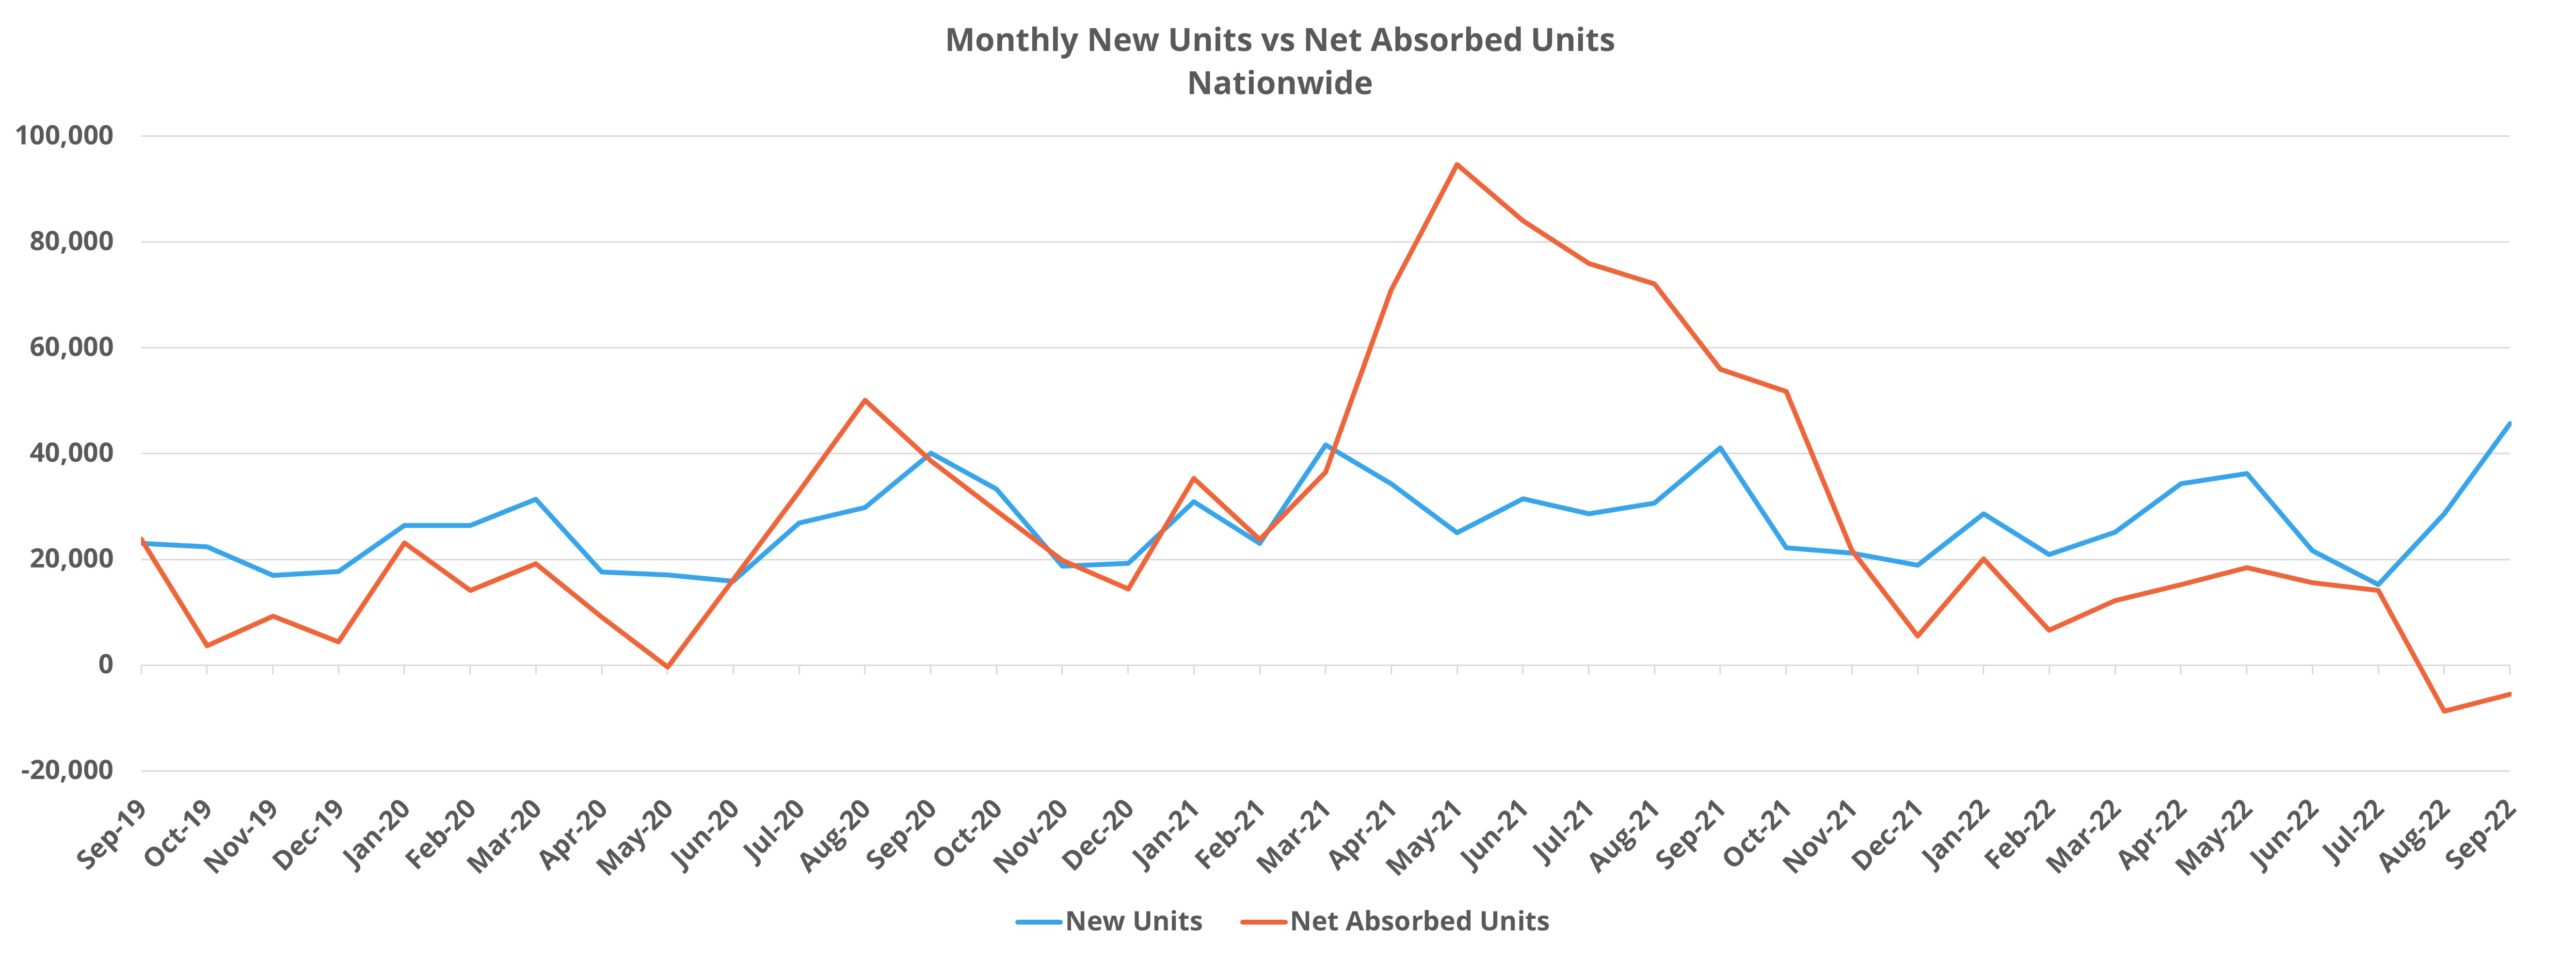
Just short of 90,000 new units were delivered nationally in the third quarter. This represented a relatively small decline from the same period in both 2020 and 2021 but was a significant increase from both 2018 and 2019. On a year-to-date basis through September, almost 265,000 new units delivered this year fell in between 2020 and 2021.
While the average construction duration continues to grow, average lease-up duration for new properties has sustained its downward trajectory and closed September at just over 12 months for properties that have stabilized in 2022.

Rent growth finally losing some steam was a major development in the third quarter, but net absorption deserves all the attention it has been getting. As already mentioned, apartment demand has been poor all year. At mid-year, 2022 net absorption was 75% lower than in that portion of 2021. Unfortunately, the picture has darkened further in the time since.
US net absorption in the third quarter was the worst in more than five years – lower even than any quarter in 2020. Approximately 60 net leased units were shed in the quarter. This means that in a three-month period in which national net absorption is typically more than 100,000 units, this year the multifamily industry suffered a net loss of leased units.
As would be expected for a period in which new supply maintained a typical level and apartment demand fully cratered, national average occupancy fell by 0.7% to finish September at just under 93%. As mentioned previously, national average occupancy has been on the decline since November of 2021. However, the third quarter decline was as large as the decline in the first two quarters combined.
Average Effective Rent and Lease Concessions
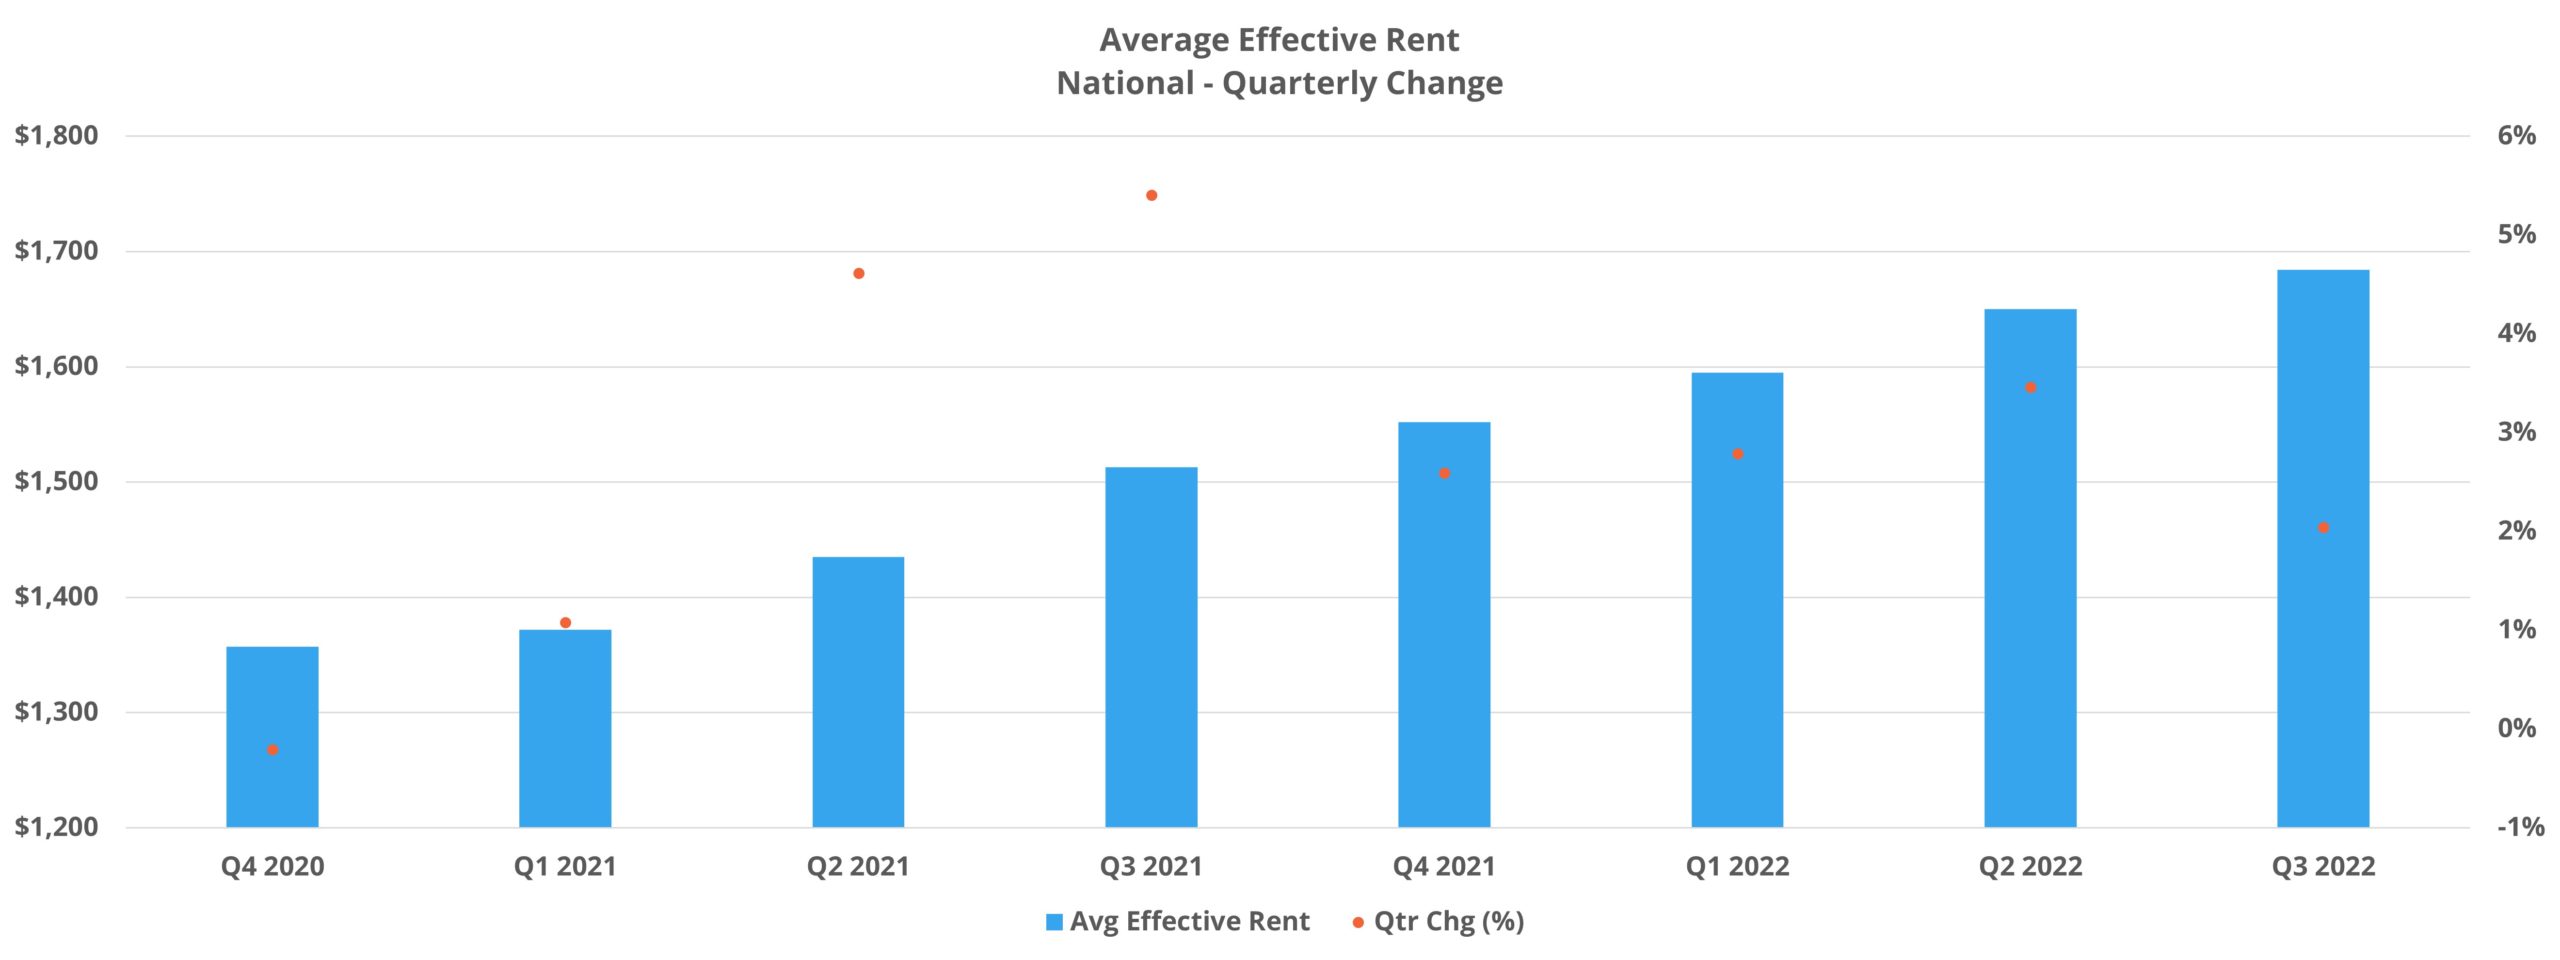
After somewhat coasting on the effects of 2021 through the first half of the year, the new reality facing the industry broke through in the third quarter for rent growth thanks largely to the further degrading of demand. For both average asking rent and average effective rent, third quarter growth was the lowest of any quarter since Q1 2021.
Average effective rent rose by 2% to finish the quarter at $1,684 per month. For some additional context, in the five quarters between Q1 2021 and Q3 2022, the average quarterly gain was 3.8%. Below just the quarterly change number, rent growth momentum slowed in each month of the period with September managing just a 0.2% gain.

From a price class perspective, average effective rent growth was stronger in the quarter for price classes A and B with the other two price classes also seeing the larger declines in rent growth compared to Q3 2021. However, Class A rent growth in the period still declined by more than 50% and Class B declined by more than 60% compared to the third quarter of last year.
For the first time since Q4 2020 lease concession availability rose nationally in the third quarter. Even so, an 11% increase in availability meant that only 8% of conventional properties were offering a discount for new leases at the end of September. This rate of availability, while higher than at the end of the second quarter, remained lower than in any quarter since the pre-COVID period. An uptick in discount availability after six straight quarters of decline provides another data point reflecting the new reality facing multifamily.
Takeaways
In many respects, the multifamily industry was operating on the momentum of 2021 for the first half of 2022. The industry came into the year with very high average occupancy, very low lease concession availability, and double-digit 2021 rent growth thanks to a demand explosion last year. The high average occupancy provided upward pressure for rents even as lackluster demand was slowly eating away at surplus occupancy. That reality transformed in the third quarter.
Very low apartment demand degraded further, even falling into very slight negative territory nationally in the period. Paired with new supply and the occupancy losses of the last six to eight months, quarterly absorption drove average occupancy down nearly a full percentage point and matched the loss from the first two quarters of the year combined.
A common explanation for the lackluster absorption results in 2022 has been a lack of household creation. This is likely part of the answer, especially given some of the developments in 2021 with elevated household creation – particularly for young adults. Another part of the answer is affordability. Looking at net absorption by price class makes this crystal clear.
While all four price classes underperformed in the quarter, the underperformance was increasingly acute moving down through the tiers. The bottom two price classes were the subsets to be in negative territory, with Class C properties shedding about 19,000 net leased units and Class D losing about 12,000 net leased units.
The fourth quarter is usually the softest for multifamily demand and the larger macroeconomic situation does not provide much reason to expect this year to be an exception. That being the case, negative net absorption in the fourth quarter appears increasingly likely as does slightly negative average effective rent growth. Were that to be the case, national average occupancy would close 2022 having eaten through all of the occupancy build-up since the onset of the pandemic.
Disclaimer: All content and information within this article is for informational purposes only. ALN Apartment Data makes no representation as to the accuracy or completeness of any information in this or any other article posted on this site or found by following any link on this site. The owner will not be held liable for any losses, injuries, or damages from the display or use of this information. All content and information in this article may be shared provided a link to the article or website is included in the shared content.

