New Construction Pipeline Continues to Grow
While apartment demand was dismal through the first half of last year, absorption rebounded in the third and fourth quarters. Over the last few months many markets, in particular those across California and Florida, managed to significantly surpass their demand performance from the same period a year ago. The resurgence in national absorption has been timely as new projects continue to be added to the new construction pipeline at a rapid pace. All told, ALN is tracking more than 2.5 million pipeline units, though more than half of that total have yet to break ground.
View the full monthly Markets Stats PDF
With that in mind, let’s have a look at markets with a high level of new supply delivered in the last twelve months and then some markets with a high level of upcoming deliveries.
New Units Delivered
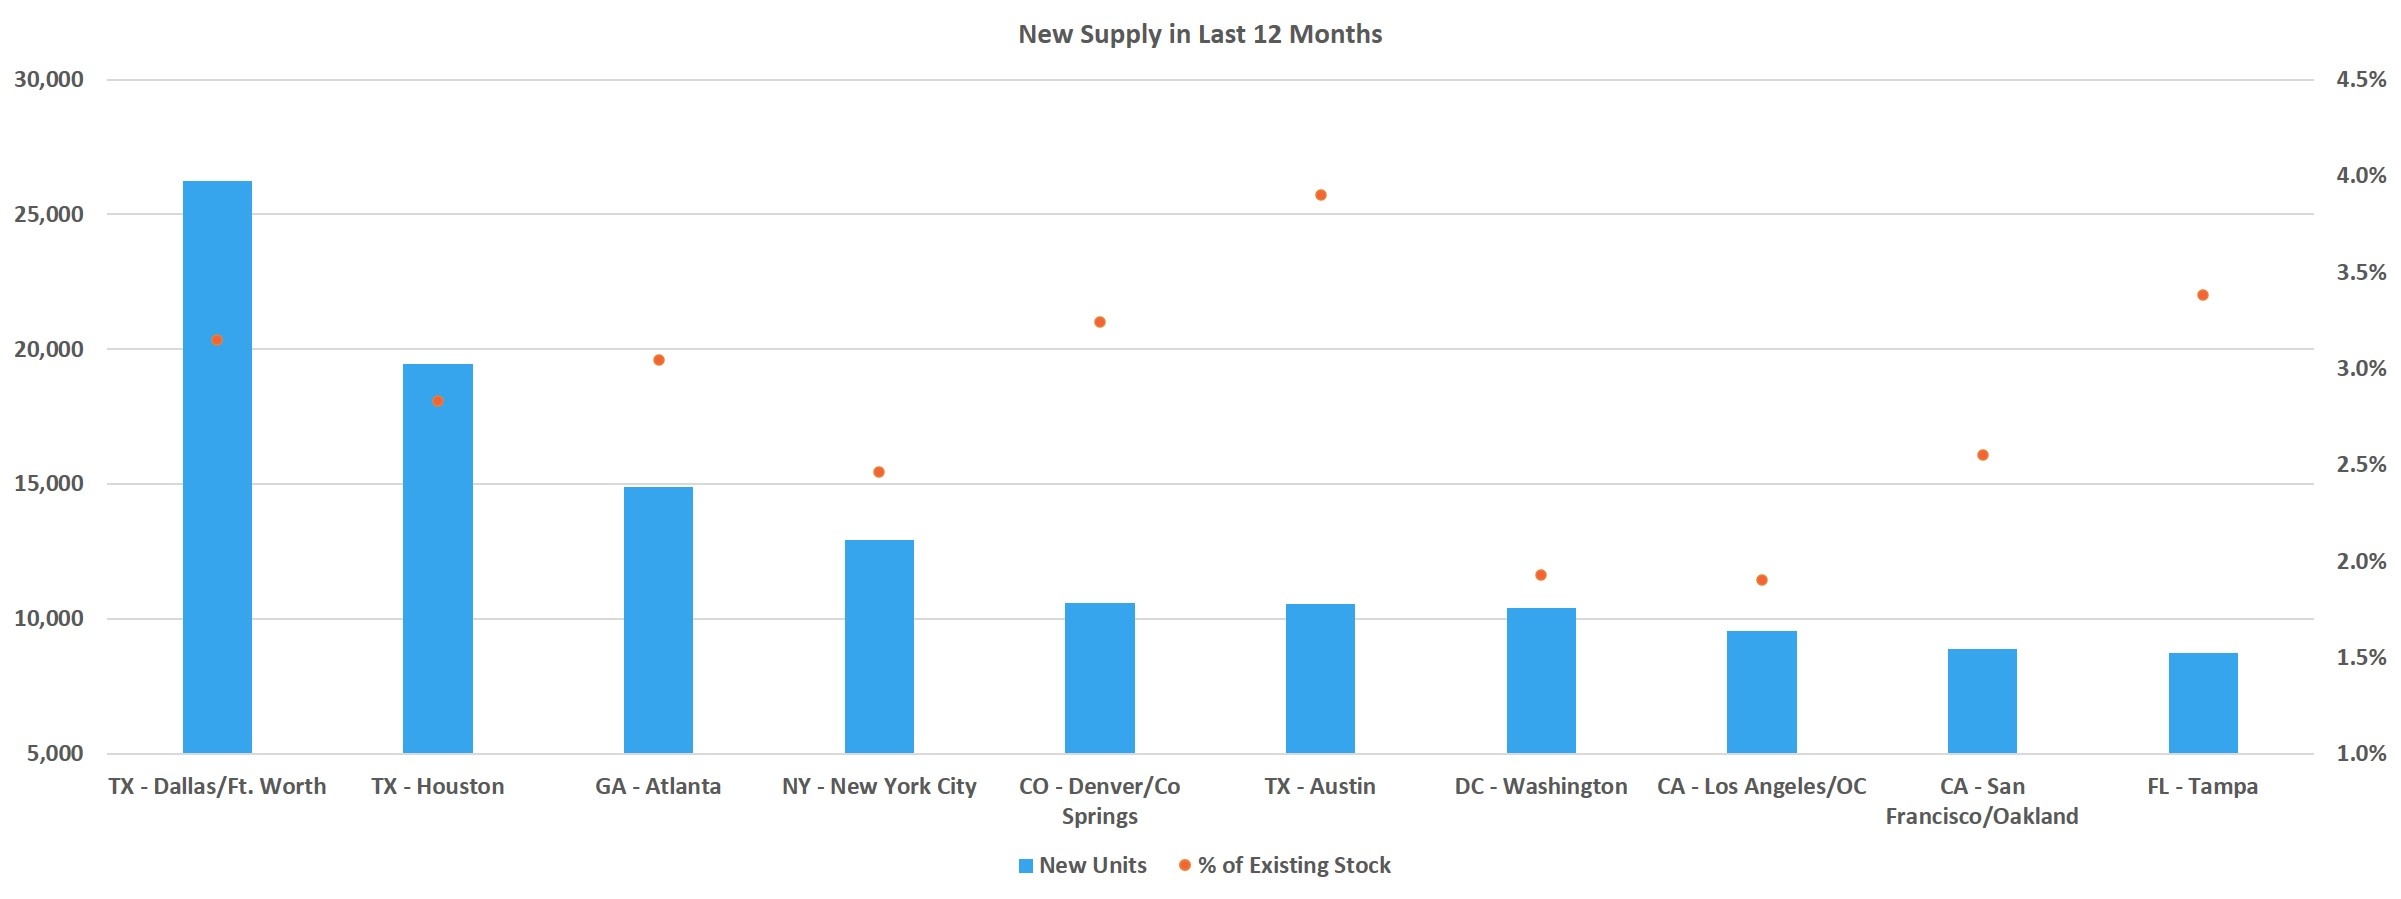
Texas is well-represented at the top of the list of markets with the most new units delivered in the last 12 months. The Dallas – Fort Worth area led the way with about 26,000 new units and the Houston market came in at number two with more than 19,000 new units introduced. Atlanta finished out the top three markets with around 15,000 new units. In total, seven markets delivered at least 10,000 new units throughout the last 12 months.
Of course, large markets will always appear at the top of the list for new supply, but there are also smaller markets with a relatively high rate of construction activity. Taking recently delivered units as a percent of existing stock brings a different set of markets to the forefront – primarily ones in Florida and North Carolina. The top five markets on this list are all located in those two states.
First is Melbourne, FL, where the more than 2,500 new units introduced in the last year account for more than 7% of existing stock in the market. Similarly, around 2,000 new units in Wilmington, NC represented approximately 7% of existing stock there. Third on the list was Miami, where about 7,500 new units accounted for more than 6% of existing units (Fort Lauderdale, FL and Asheville, NC round out the top 5). Expanding the list to the top 10 markets on a percentage basis, Florida markets account for half of that list.

Under Construction
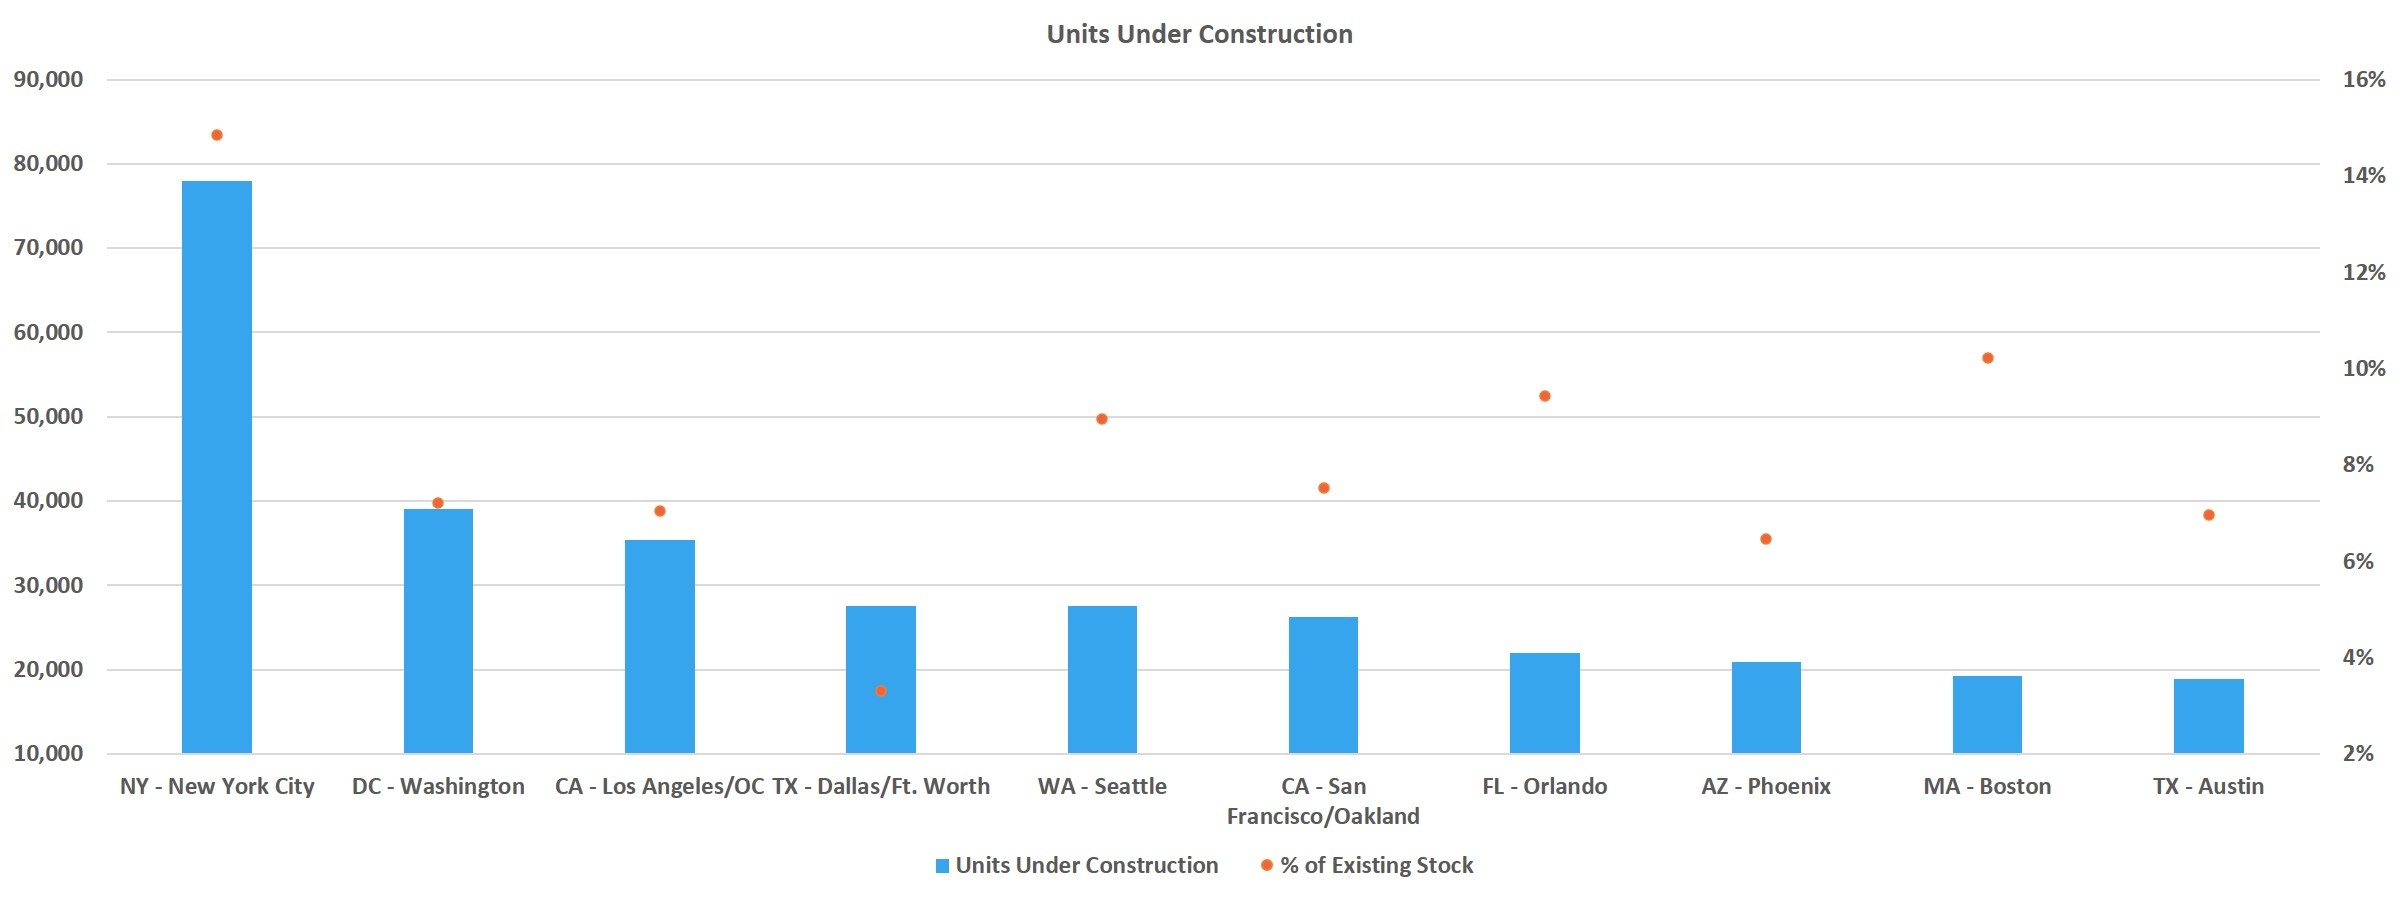
Projects in this stage of the construction pipeline have already broken ground but have not yet begun to lease. With more than 78,000 units under construction, the Greater New York City market has by far the most units in this phase of the pipeline. This volume of upcoming new supply represents 15% of current stock, more than double that of the most active market over the last year by this metric.
The Washington DC area, with just fewer than 40,000 units under construction, has the second-most volume in this phase of construction. These units account for around 7% of existing supply. In third place is the Los Angeles – Orange County area. The more than 35,000 units currently being built there also account for around 7% of existing supply.
While New York leads the way among US markets in terms of units under construction as a percent of current stock, the metric does bring some smaller markets into focus as well. The Augusta – Portland area of Maine only has about 1,000 units under construction, but these units are equal to 14% of existing capacity there. In the Miami area, about 15,000 new units under construction represent around 13% of existing stock. Nearly 3,000 units being built in Boise are similarly equal to approximately 13% of existing capacity.
The only other large market within the top 10 markets on a percentage basis for units under construction is Boston, sitting at 10% with a little more than 19,000 units currently being built. Once again Florida is robustly represented with four of the top 10 markets.
It is important to keep in mind that although the percentages mentioned for these markets are each well above those based on recently delivered units, these under construction units will not all be delivered within the next twelve months.

Takeaways
New construction deliveries continue apace, and new projects are being added to the pre-construction pipeline at an increasing rate. In terms of most deliveries within the last twelve months, the large southern markets led the way. When switching to a view based on new units as a percent of existing stock, Florida and North Carolina markets are where the new deliveries were most concentrated.
Regarding units that are under construction but not yet leasing, the New York metro area is far and away the leader. In this phase of the pipeline, the large urban markets along the coasts dominate. Markets like Washington DC, Los Angeles – Orange County, and the California Bay Area all appear near the top of the list. When considering markets on a percentage basis, Florida again is heavily represented as it accounts for four of the 10 top markets.
It will be especially important moving forward to pay attention not only to which markets have the most upcoming new units, but how the demographic profiles of the markets are evolving. COVID-19 and technology are changing the demographic landscape. High construction volume in growth markets like Boise, Dallas Fort – Worth or those across Florida will impact those markets quite differently than in expensive urban markets like the New York metro area or the California Bay Area that have experienced pronounced population loss.
With the sharp downtown in apartment demand experienced through the first half of 2020, some concern was merited regarding the influx of new units into this new paradigm. Fortunately, during the second half of 2020 demand rebounded strongly and this continued through January of 2021.
With the COVID-19 vaccine rollout continuing, there is at least some light at the end of the tunnel regarding a return to something resembling normalcy. Combined with the encouraging changes to the apartment demand picture, the continued pipeline growth may not act as powerfully as a headwind in the near term as it appeared last summer.
Search, Analyze & Compare
ALN OnLine is a web portal that allows our clients to search properties, access submarket and markets trends, new construction, and more. Since 1991, we have continued to refine our business practices and methodology in order to offer our clients the absolute best in multifamily data.

Disclaimer: All content and information within this article is for informational purposes only. ALN Apartment Data makes no representation as to the accuracy or completeness of any information in this or any other article posted on this site or found by following any link on this site. The owner will not be held liable for any losses, injuries, or damages from the display or use of this information. All content and information in this article may be shared provided a link to the article or website is included in the shared content.

