

Multifamily Rent Growth Accelerates
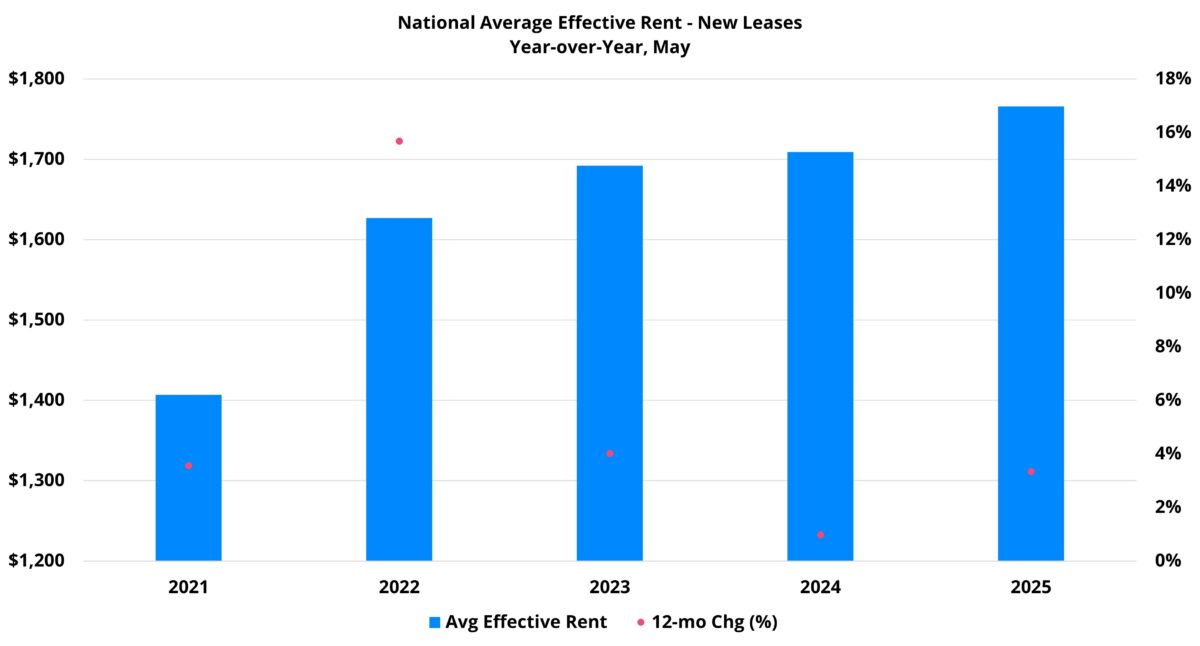
With operating expenses still elevated and transaction volume lower than usual despite recent signs of life, improvement in the rent growth environment would be a welcome sight. Average effective rent growth for new leases rose 3.3% nationally over the last twelve months. That rate of appreciation more than tripled the gain from the previous twelve-month period. Rent growth varied by region and price class, but the national trend has been nothing but positive.
All numbers will refer to conventional properties of at least fifty units. Rents refer to the rent for new leases.
View the full monthly Markets Stats PDF
National Trends
A 3.3% average effective rent gain over the last twelve months was the most robust gain for that portion of the calendar since the 4% jump in the period ending in May 2023. At that time, most of the rent growth was from 2022. An explosion of multifamily demand in 2021 drove occupancy unusually high and helped to fuel unusually strong rent growth through 2022.
In the first five months of 2023, rent growth equaled a modest 1.2%. This year, rent growth reached 1.7% through May. While the last twelve months have not quite stacked up to the twelve-month period ending in May 2023, with context, it has arguably been more encouraging for future industry prospects. Rent growth momentum has continued to build with the turn of the calendar from 2024 to 2025. Also, the momentum has been based on current demand trends rather than on an anomalous demand surge already in the past.
Apartment demand has swelled this spring. Net absorption of around 220,000 units through May allowed apartment demand to outpace new supply in the period for the first time since 2021. The resulting average occupancy gain was only 0.1% but was nevertheless preferable to the declines from the last three years. With deliveries expected to recede in the second half of the year, 2025 features the best chance for an annual occupancy gain, however modest, since 2021.
Regional Differences in Rent Performance
The strongest rent growth has occurred in regions where less new supply pressure in recent years has allowed for greater market balance. These regions have not necessarily featured particularly robust demand. Rather, less new supply has simply necessitated less net absorption to preserve above-average occupancy.
The Northeast, Great Lakes, and Midwest regions led the way over the last year in rent growth. Broken down by NAA region, regions one, two, three and five all managed average effective rent growth for new leases in excess of 5% over the last twelve months.
Regions six, seven and eight were the portions of the country most below the national mark of 3.3% in the last year. These cover roughly Texas and the Southwest, the Mountain West and the Pacific Northwest. In some cases, demand has been an issue but rent growth has been muted in these areas mostly due to supply pressure.
The Mountain West regional result was a bit misleading. Four of the six states captured rent growth well above the national average. However, the two largest states by multifamily stock, Colorado and Utah, underperformed. Colorado saw an average rent decline while Utah managed a gain of less than 1%. One portion of the country that has managed to walk the tightrope of both a huge quantity of new supply and near-average rent growth was NAA region four. This region includes the Carolinas, Georgia, Tennessee and Kentucky. Average effective rent growth for this region rose by 2.9% over the last twelve months thanks in no small part to nation-leading apartment demand in the period.
Price Class Differences in Rent Performance
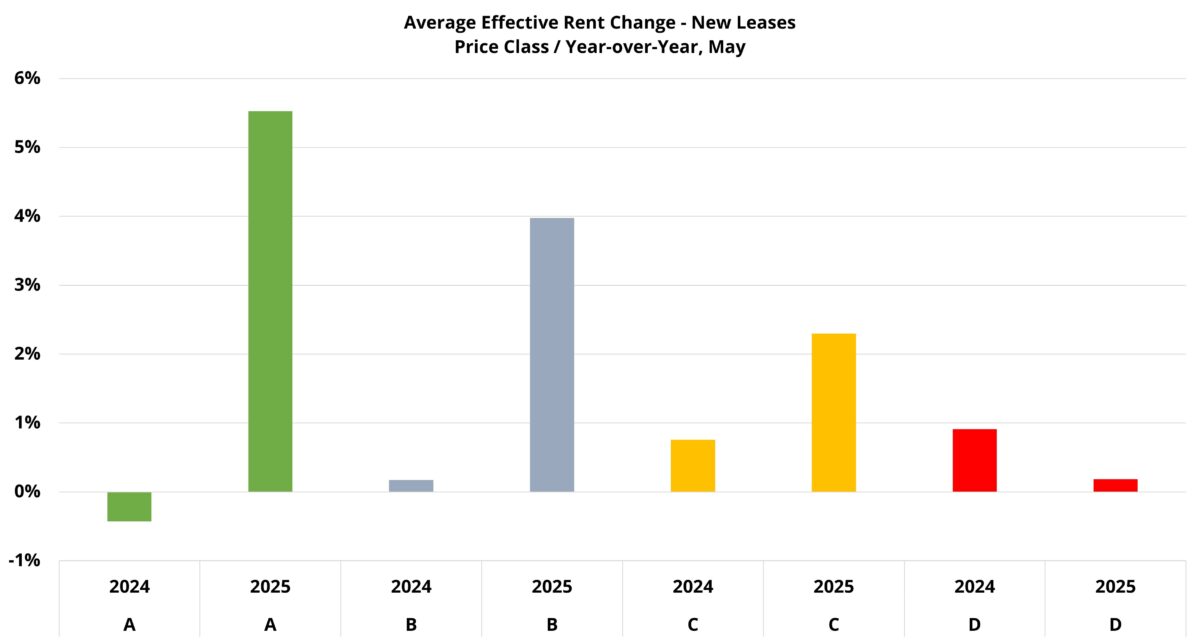
Rent performance by price class has undergone a few important shifts recently. For one, properties at the top of the market have led the way in rent growth over the last year.
Average effective rent growth for the Class A subset hit 5.5% in the period. For Class B, the appreciation was 4%. This represented a sharp turnaround for both. Class A saw average rent decline by about 0.5% in the previous period while Class B managed a gain of less than 0.5%. Strong demand and declining lease concession availability have helped to boost effective rent growth at the top of the market.
Class C, with a gain of 0.8% from June 2023 through May 2024, had been just behind the leader among the four price tiers for rent growth. Over the last twelve months rent performance improved, but a 2.3% gain was lower than the top two price tiers by a comfortable margin. One difference was that lease concessions continued to play a growing role and offset some of the gains in average asking rent.
Class D was the only price tier to see a reversal in progress for rents. A 0.2% gain over the last year was considerably smaller than the 0.9% increase from the previous period that had previously made this subset the leader in rent growth.
The silver lining for Class D properties was the slowdown in rent growth came alongside a rebound in apartment demand. This segment of the industry had been the last to recover from the 2022 demand trough. That recovery materialized in earnest over recent months.
Factors Driving Positive Trends
Some reasons for rent growth improvement have already been mentioned. Certain portions of the country have maintained a greater balance between supply and demand in recent years. That balance has not only fueled rent growth there but has driven the national average up.
In other areas, demand has been on the rise for more than two years and has now returned to a level that can mitigate the impact of high new supply. A decline in lease concession availability in the premium segments of the industry has also decreased the spread between asking rent and effective rent to the benefit of average effective rent.
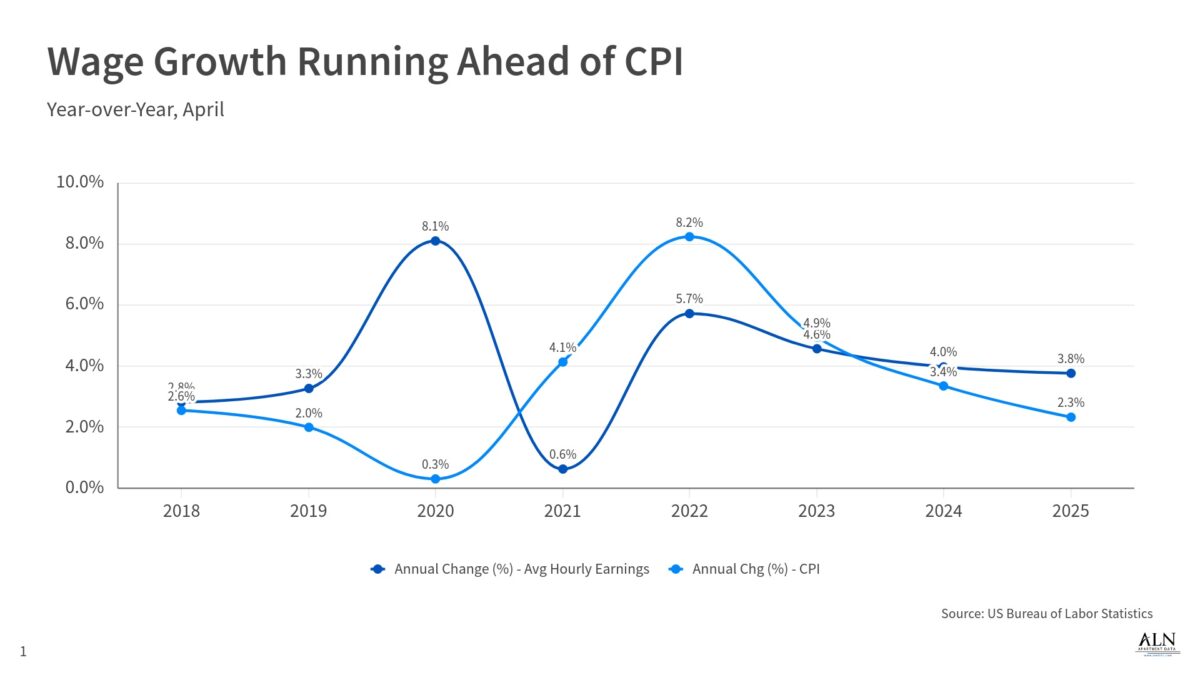
Average hourly earnings as reported by the Bureau of Labor Statistics have outpaced consumer-side inflation measured by the Consumer Price Index (CPI) for two years now – and counting. This return to real wage growth has allowed some balance to reemerge after multiple years with inflation running ahead of wage growth.

Make informed decisions with up-to-date data from every U.S. market, available through ALN OnLine.
The job market, while showing some cracks, has remained solid. For now, employment is strong enough when paired with real wage growth to support the positive rent gains that have occurred.
The still frozen for-sale side of the residential market has had some impact as well. In general, a healthy for-sale sector benefits multifamily rent growth. A healthy housing market reflects a healthy economy more broadly, and a healthy economy helps to drive rent growth. However, keeping people in multifamily properties that would have ultimately transferred to the for-sale side does increase occupancy and demand. This is particularly true for the Class A and Class B subsets in markets traditionally skewed toward home ownership. This effect should remain in place through at least the rest of the year.
Takeaways
Rent growth has been on the mend for a little more than a year now. Apartment demand has been steadily rising for more than two years and remains the primary fuel for the rent growth turnaround.
New supply is expected to slow down in the back half of 2025 and should allow high volume markets to continue to mitigate occupancy declines and then begin a turnaround. This is especially the case across the Sunbelt. A deluge of deliveries in that region has often muted market level rent growth even when paired with strong apartment demand. More balance in these markets provides a real opportunity for rent growth to improve. That regional improvement should ultimately be reflected in the national rent growth data.
Price class dynamics also align well for continued rent growth progress. Class C rent growth has already made steady progress on the back of improved demand. Class D apartment demand has made significant progress over the last year and further movement along that trajectory should eventually translate into higher rent growth.
Of course, while there is plenty of reason for optimism, caveats remain. As already mentioned, some cracks have emerged. The unemployment rate has not been higher than its current 4.2% since late 2021 when it was on the way down from the pandemic highs. Sectors such as Business and Professional Services and Information have started to move in the wrong direction. In addition, general geopolitical risk and trade policy uncertainty must be mentioned as issues with the potential to change the status quo in a meaningful way. However, broadly speaking, multifamily trends look quite positive relative to the durability of the positive rent growth trajectory.
Disclaimer: All content and information within this article is for informational purposes only. ALN Apartment Data makes no representation as to the accuracy or completeness of any information in this or any other article posted on this site or found by following any link on this site. The owner will not be held liable for any losses, injuries, or damages from the display or use of this information. All content and information in this article may be shared provided a link to the article or website is included in the shared content.
ALN Apartment Data delivers industry-leading multifamily market intelligence, empowering thousands of apartment industry professionals with accurate, research-driven insights. Don’t wait, request a live demonstration today!
Owners and Management Companies
Leverage ALN OnLine for property search, rental market analysis, and competitor benchmarking—ensuring data-driven decision-making. Discover more about ALN OnLine here
Multifamily Suppliers & Service Providers
Supplier Partners nationwide trust Vendor Edge Pro to identify property management companies, target apartment communities, and optimize B2B sales strategies with our curated data and must-have features like sales routing. Get started with Vendor Edge Pro today
Enterprise-Level Multifamily Suppliers scale their business with Compass, the ultimate tool for nationwide property and management company insights, targeted prospecting, and market expansion strategies. Explore Compass now
Not sure how we can help you? Learn more about all of our services for Multifamily Professionals