

Improvement in Multifamily, but Challenges Remain
Welcome to 2024! A new year is here, and another year is in the rearview mirror. 2023 was a step in the right direction for apartment demand after a tough 2022, but more ground remains to be gained. 2023 was also the year rent growth finally fully returned to Earth after an incredible run in 2021 and 2022. Looking ahead, there is reason for optimism for multifamily performance in 2024 as well as potential for further challenges.
All numbers will refer to conventional properties of at least 50 units.
View the full monthly Markets Stats PDF
2023 Apartment Demand Improvement
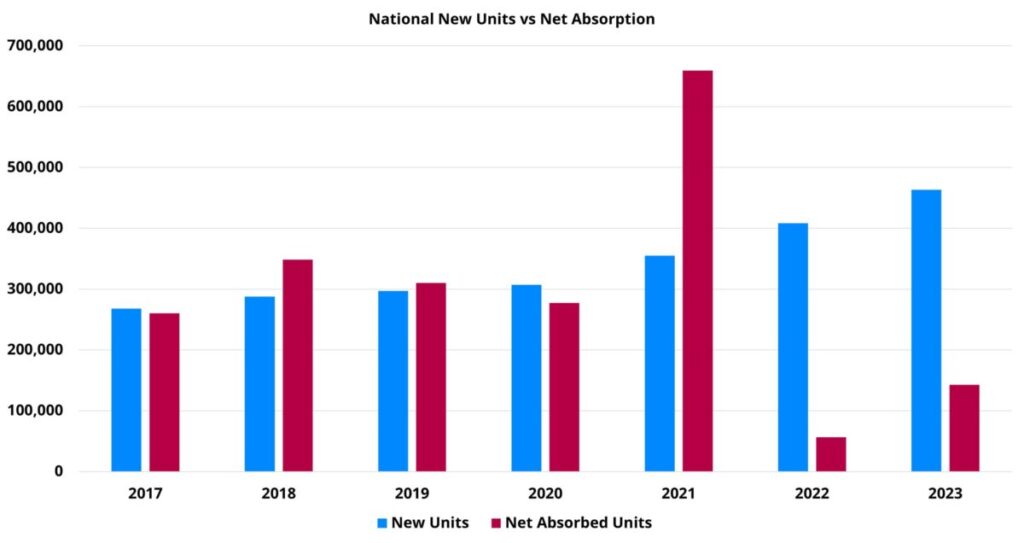
One of the major components of 2023 multifamily performance at the national level was a resurgence in apartment demand. A little more than 140,000 net units were absorbed through the year – a nearly 150% increase from the paltry 2022 total.
The improvement was most robust for the middle two price classes. With almost 70,000 units, Class B net absorption in 2023 was more than 50% higher than in 2022. For Class C properties, a net loss of approximately 23,000 leased units in 2022 was followed by a net gain of around 27,000 leased units in 2023.
The downside from the demand picture in 2023 was that the increase in net absorption was not enough to return the industry to its pre-pandemic annual average. For the three years from 2017 through 2019, average annual net absorption nationally was about 306,000 units. The 2023 value was less than half that figure. While apartment demand was taking a step in the right direction, the new construction pipeline was trucking along at the incredible pace that it has been on in recent years. More than 460,000 new units were delivered nationally in 2023 – an historic total. The 240-basis point decline in overall average occupancy nationally that resulted from the supply – demand relationship last year was the final nail in the heady rent growth of the previous two years.
Rent Growth Finally Sputtered
To end 2021, more than 650,000 net units had been absorbed nationally and average occupancy had risen to 94% after opening the year at 92%. Within that context, annual average effective rent growth for new leases finished 2021 with a 14% gain. In 2022, with the benefit of 94% national average occupancy out the outset, average effective rent growth closed the year with an 8% increase despite lackluster demand.
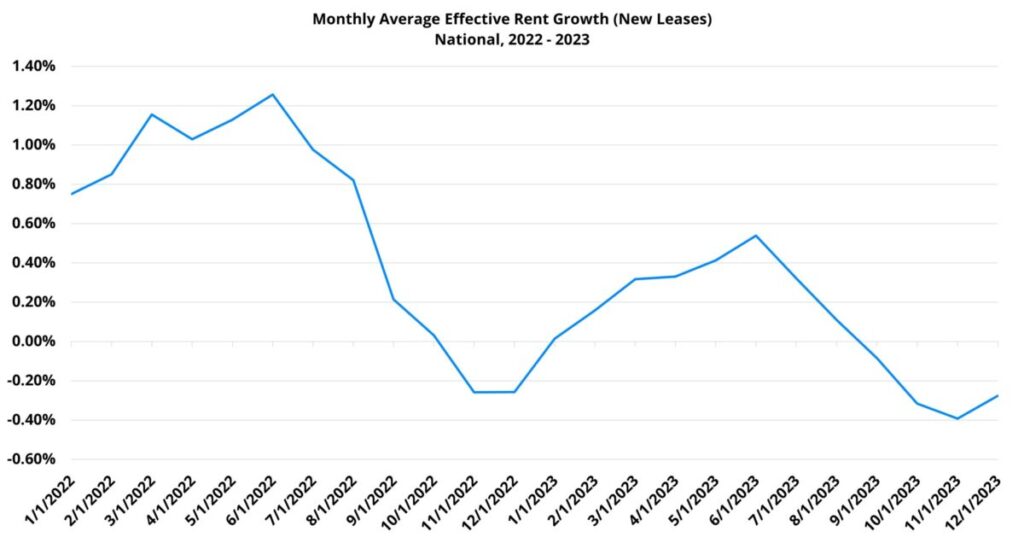
In 2023 the benefit of leftover elevated occupancy was gone to begin the year and the national average to end the year had fallen all the way to 89%. Average effective rent growth for new leases weakened from 8% in 2022 to just 1% in 2023. At the end of August this year, year-to-date rent growth was already slightly above 2%. However, the last four months of the year each suffered a decline that ultimately offset half of the gains achieved through August.
It is worth noting that last year also saw the return of much more normal seasonality in the national rent data. In a typical year, rent growth is more tepid in the first and fourth quarters with the bulk of annual rent growth achieved in the middle months. The first seven months of 2022 all managed an average effective rent gain of at least 0.8%.
2023 more closely resembled the usual trend with rent growth ramping up in the second quarter after a slow start to the year. The divergence that remained was that monthly rent growth had already cooled by August and was negative by September.
Looking Ahead: Labor Market
The labor market cooled some in 2023 but remains tight. National unemployment increased slightly from the start of the year but remained at 3.7% in the latest month of data. The average monthly value in 2019 before the COVID pandemic was 3.7%. The labor force participation rate currently sits below where it was pre-pandemic but improved slightly in 2023. Both initial weekly jobless claims and continuing weekly jobless claims remained stable and within their normal range all year.
The labor market will continue to be key for multifamily performance in 2024 because of the state of household finances. Between the rent growth of the last few years, single-family housing prices, and mortgage rates – cost for shelter is up across the board. The return of student loan payments in the fourth quarter of last year reintroduced a debt burden to millions of households.
Credit card debt has increased with some estimates from sources like Lending Tree, TransUnion, and Bankrate pegging the share of cardholders carrying debt from month-to-month at around 50%. At the same time, the personal savings rate, according to the U.S. Bureau of Economic Analysis, has been at a low since the beginning of 2022 not seen since the 2007-2008 period.
Less savings, more debt-fueled consumption, and higher costs for necessities combine into a situation that is not ideal but is manageable while the labor market remains tight. However, the picture can shift considerably if the unemployment rate goes from 3.7% to 4.7% or 5.7%. Once the paychecks stop, with little savings and some consumer debt – the emergency brake comes on.

Looking Ahead: Single-Family Housing
Each of these topics could be their own article, and single-family housing is certainly no exception. The conventional wisdom seems to be that high mortgage rates, stubbornly high prices, and low supply will continue to be an issue for single-family housing to the benefit of multifamily demand in 2024. This appears to have been the case in 2023 and may well hold in 2024.
Even so, this is a concentrated effect for Class A and Class B properties and for markets with a reasonably high rate of homeownership. This also is not a guaranteed multifamily demand boost in 2024.
New home builders have already adjusted to the new environment. One of their primary tools appears to be reallocating floorplan upgrade allowances to mortgage rate buydowns in order to entice buyers and compete with existing home sales. The result has been some movement on the new home side of single-family.
For existing homes, a major factor mitigating the decline in prices has been low supply. People that do not have to move and that have an interest rate below 4% are understandably not in a hurry to list their house. But, if the situation with the economy and labor market changes, and suddenly savings-strapped and debt-laden households need to quickly sell their houses with no income coming in – there could be a shift in the supply picture at a time when demand would likely still be low, and the result would be lower prices.
Looking Ahead: Multifamily New Supply
One aspect of 2024 multifamily performance that does not require a crystal ball or cutting-edge algorithms to anticipate is new supply. With an average construction duration of around 20 months, properties that will be entering the market in 2024 were already under construction in 2023.
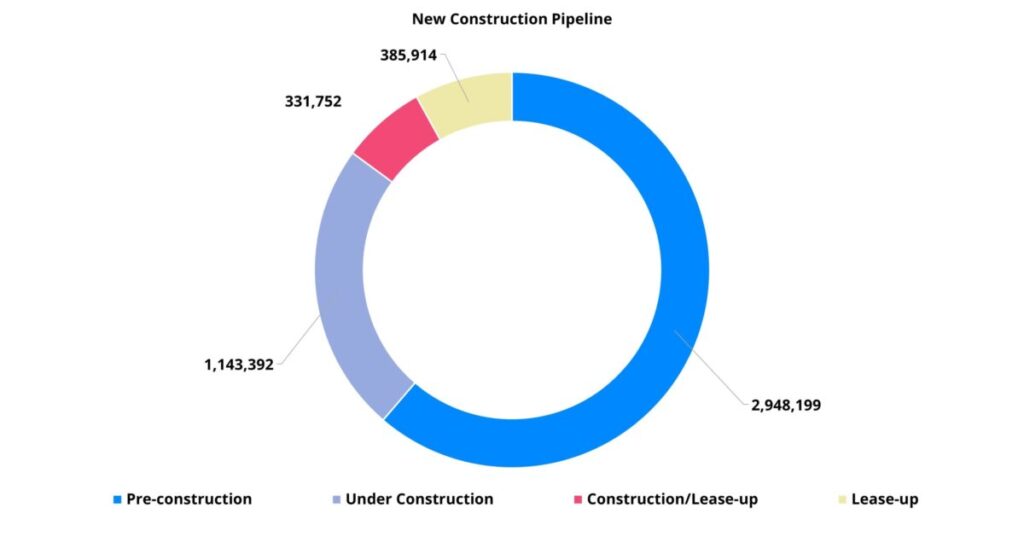
2024 is positioned to be the third consecutive year for national deliveries to exceed 400,000 units. While the Sunbelt rightly gets the lion’s share of attention with new supply, the construction pipeline remains a national story. ALN is currently tracking more than 1.1 million units around the country that have already broken ground but are not yet leasing. This is in addition to more than 700,000 units that are currently in some stage of the lease-up phase.
When considering the number of units under construction as a share of existing stock, Boise leads the way at 33%. Miami is right behind at 30%, followed by Fort Myers – Naples (22%), Asheville (21%), and Charlotte (19%). For most of the Mountain West and Sunbelt markets near the top of the rankings, the pressure from new supply in the short term is likely to be a challenge but is not a doomsday scenario. These are areas that have seen consistently high population and jobs growth for a decade or more in most cases.
The Northeast region is a little different. In Connecticut, Massachusetts, New York, and Vermont, units currently under construction account for at least 10% of existing stock at the state level. With the exception of Vermont (38%), which has more to do with the relatively small number of existing conventional properties of at least fifty units, these states are all hovering between 10-13%. Not massive numbers, but the net migration data in particular does not look the same in this region as in the Mountain West or Sunbelt.

In our series Takeaways, ALN Apartment Data Senior Market Analyst, Jordan Brooks, shares more insight into the final thoughts on the April 2024 newsletter article…
Takeaways
2023 was a bit of a mixed bag for multifamily. Apartment demand improved considerably from 2022, but not enough to avoid another large national average occupancy decline in the face of more than 460,000 newly delivered units. With supply outpacing demand by a wide margin, and average occupancy falling to a level not seen in more than a decade, average effective rent growth barely managed to stay above water.
Looking ahead to 2024, a continued status quo of receding inflation, a tight labor market and low rent growth would be helpful in returning apartment demand closer to its pre-pandemic levels.
It is almost impossible to envision a scenario in which apartment demand would be able to match 90% of new deliveries in 2024 in order to maintain current average occupancy. This means that 2024 may well resemble 2023 with low occupancy pressuring rent growth but demand continuing to improve. As in 2023, concessions in 2024 seemed destined to increase.
2024 is also a presidential election year, multiple major global economies are showing some cracks, and there are two major wars ongoing. As with the onset of the COVID pandemic in 2020, the occurrence of a black swan event means all previous expectations have to be scrapped. Buckle up, 2024 will not be boring.
2024 Market Mastery
Stay ahead in multifamily with our data-driven insights and gain a competitive advantage. Learn from our experts in a detailed, personalized one-on-one webinar.
Disclaimer: All content and information within this article is for informational purposes only. ALN Apartment Data makes no representation as to the accuracy or completeness of any information in this or any other article posted on this site or found by following any link on this site. The owner will not be held liable for any losses, injuries, or damages from the display or use of this information. All content and information in this article may be shared provided a link to the article or website is included in the shared content.