

Mixed Results to Begin 2024 for Multifamily
The first quarter of 2024 was a mixed bag for the multifamily industry. Net absorption in the quarter tripled the total from the same period last year and rent growth regained positive ground. Yet, first quarter net absorption was also lower than in any recent year aside from 2023, and rent growth was the lowest for an opening quarter in years.
Therefore, context is particularly important when evaluating where the multifamily industry currently stands and where it may be headed through the rest of 2024. The first quarter played out broadly to expectations, but some uncertainty remains.
All numbers will refer to conventional properties of at least 50 units.
New Supply
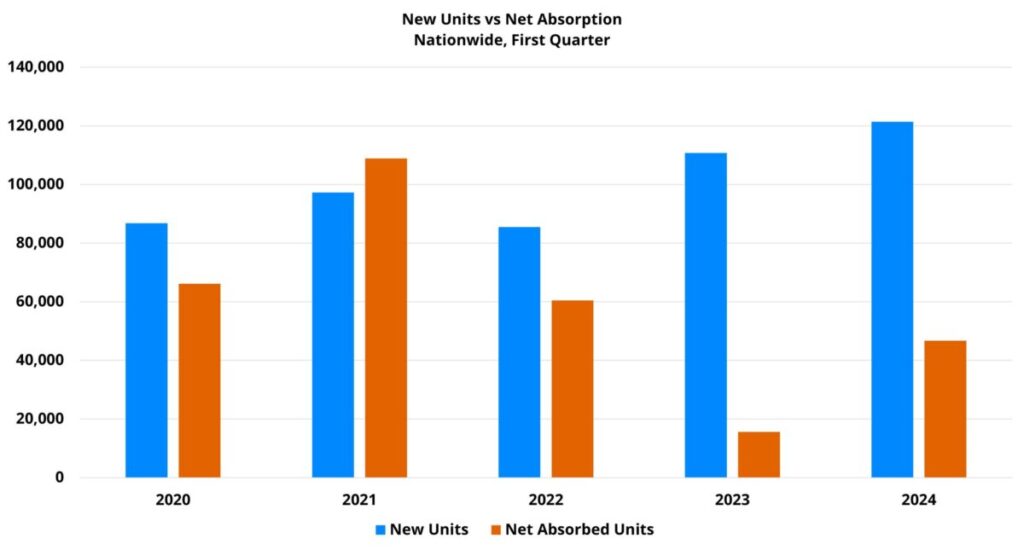
The new construction pipeline continues to be the protagonist in the multifamily story. In the last few years national deliveries have reached heights not seen in decades, and 2024 will be another year in that vein. More than 120,000 new units were introduced nationally in the first quarter. 2023 was the first year to crack 100,000 new units in the first quarter, this year has already seen another 10% increase over that short-lived peak. For additional context, the five-year average for new units in the opening quarter from 2019 through 2023 was approximately 91,000 units. The 2024 value was 33% higher than the five-year average.
One of the distinctive features of 2023 was the distribution of new units across the price classes. With the new construction cycle so long in the tooth, development activity increased in more outlying submarkets and submarkets with an average effective rent outside the top of their market. As a result, properties were entering the market still at or near the top of their submarket in average effective rent, but not necessarily positioned at the top of their overall market. Because ALN calculates price class for a property at the market level, price tiers outside of Class A saw more new supply than had been typical last year. So far in 2024, this has continued.
At the market level, Dallas – Fort Worth was in a category of its own with just over 9,000 new units delivered in the quarter. Houston and Denver – Colorado Springs rounded out the top three markets with just over 6,000 new units each. Other usual suspects such as Austin, Atlanta, and Phoenix populated the top of the new deliveries list.
Areas like Myrtle Beach, Flagstaff, Pensacola, and Tallahassee led the way in first quarter deliveries as a share of existing stock.
View the full monthly Markets Stats PDF
Net Absorption
National apartment demand was similarly detached from the five-year average in the first quarter, but to the downside. Approximately 47,000 net absorbed units was an impressive 200% increase from the same period last year but was nevertheless 30% below the five-year average for the first quarter of around 67,000 net absorbed units.
A recent blog post detailed first quarter apartment demand, but there were a couple of developments in the data worth highlighting. The first was the robust month-over-month improvement in national net absorption. Each month of the first quarter roughly doubled the net absorption total of the previous month.
April through about July tends to be the strongest period of the year for multifamily demand. The monthly data reflect a positive trend leading into that period, and the quarterly data reflect consistently improving demand for a full year. Both bode well for the coming months.
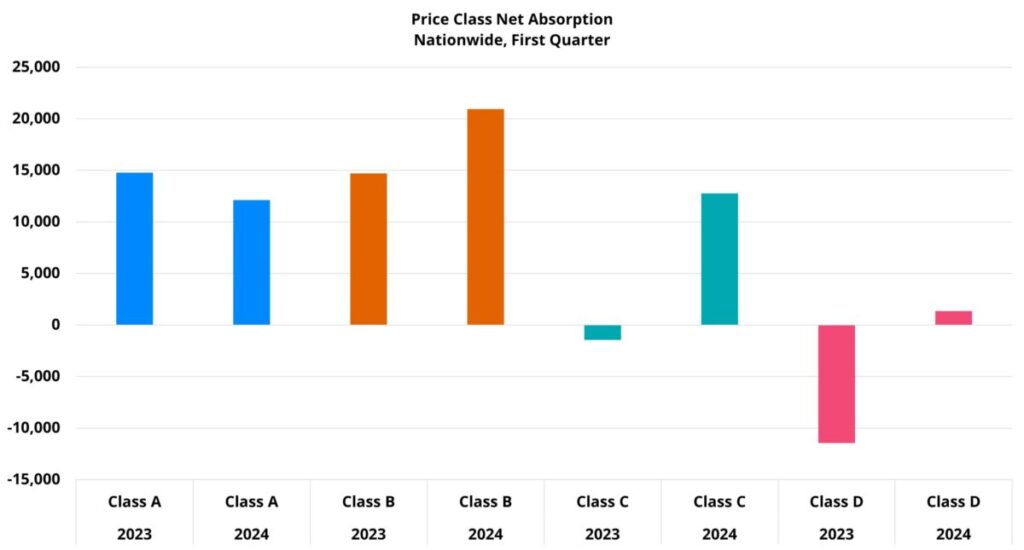
Another encouraging development in the first quarter was the improvement in the Class C and Class D price tiers. These two subsets have been struggling for the last couple of years from a demand perspective – particularly Class D. The almost non-existent net absorption for Class C and the net loss of leased units for Class D has been a headwind to overall national net absorption totals.
Class C net absorption of nearly 13,000 units in the first quarter this year followed a net loss of around 1,500 leased units in the opening period of 2023. For Class D, last year’s net loss of more than 11,000 leased units in the first quarter was followed by this year’s net gain of more than 1,300 leased units. As with national net absorption, both results this year remain below the longer-term average, but continued improvement would be a boon for industry performance in 2024.
Average Occupancy
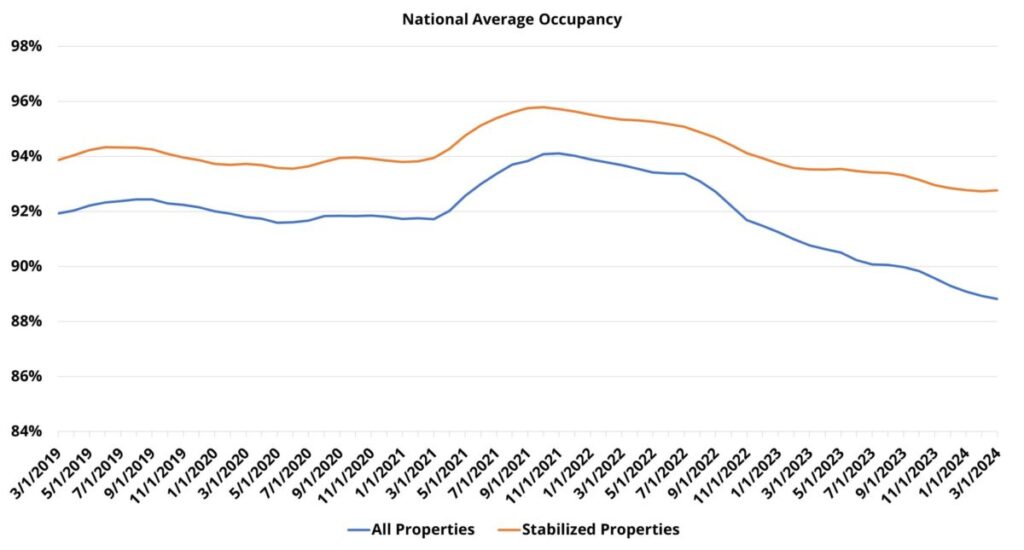
About 75,000 more units were delivered than absorbed in the first quarter nationally, and so national average occupancy fell 0.5% to just under 89%. Despite the continued occupancy decline, this year’s opening quarter represented an improvement from last year’s 0.8% loss thanks to the higher net absorption to open 2024.
For properties that began the year already stabilized, national average occupancy ended March just below 93%. This average was unchanged from the start of the year due to net absorption for stabilized properties totaling less than 300 units nationally in the period. This was a far cry from the norm, but much better than the net loss of around 35,000 leased units in the opening period of 2023.
National average occupancy appears to be at its lowest point since the Great Financial Crisis. What can be said with certainty is that multifamily occupancy resides in waters not charted in any time from the middle of the last decade.
If apartment demand can maintain the pace set by the first quarter and triple 2023 net absorption this year, average occupancy should roughly remain where it ended the first quarter. That would mean closing 2024 below 90% for a second consecutive year. If apartment demand is not able to keep its current pace relative to last year, average occupancy will fall further in 2024 due to the volume of new supply.
Average Effective Rent and Lease Concessions
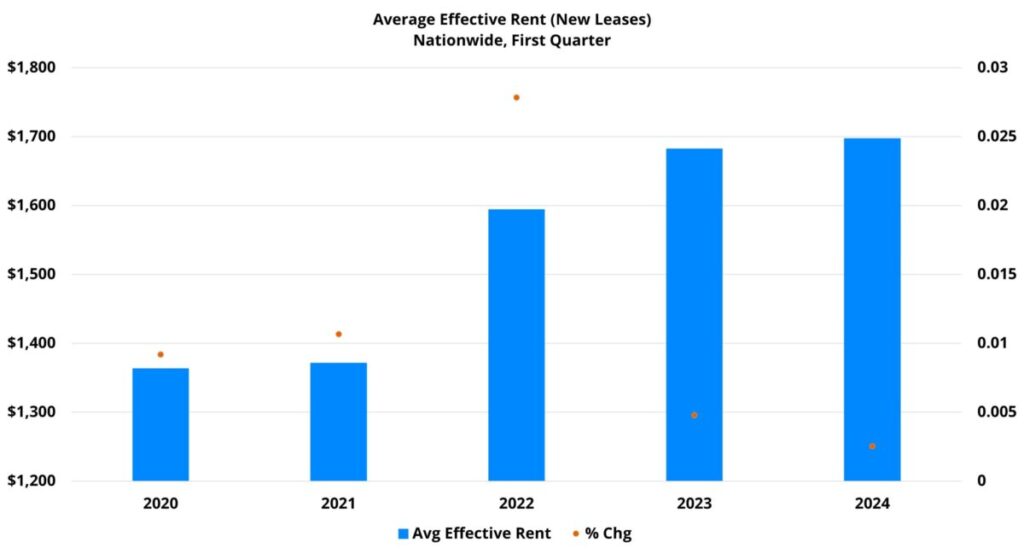
A 0.3% gain in average effective rent for new leases brought the national average to $1,697 to close March. The quarterly gain was the lowest in more than five years but was at least in positive territory. It will be little consolation to owners and operators dealing with a challenging environment, but as a point of context for apartment demand, average monthly effective rent to end March was about $325 more than the average three years ago.
From a price class perspective, the rent growth captured in the period was from the top of the market. Class C average effective rent was virtually unchanged in the quarter and the Class D average fell by 0.8%. Quarterly rent change for Class A and Class B exceeded last year’s numbers for the period, and both price tiers were roughly back within their normal range for this time of year. Class C and Class D each underperformed relative to last year and their longer-term ranges.
Lease concession availability ended the quarter back in the range of the COVID-era peak with 20% of conventional properties offering a discount for new residents. In fact, March availability equaled that from December of 2020 – the peak for the pandemic period.
A feature of the last year or so has been that the difference in lease concession availability between the price classes has winnowed. By the end of the first quarter, Class A led the way in typical fashion with 23% availability, but Class B (21%) and Class C (19%) were right behind. Availability was lowest for Class D properties, but the 18% of properties offering a discount was a highwater mark in recent years.
Takeaways
Depending on which metrics are highlighted, the opening quarter of the year can fit a wide range of narratives. National apartment demand tripled last year’s opening quarter while rent growth remained positive. Also, the continued misalignment of new supply and net absorption pushed an already-low average occupancy even lower and helped to drive lease concession availability back to the peak of 2020.
Quarterly results were broadly what was expected. Demand continued to show signs of life but was completely overpowered by new supply. This sent occupancy down, concession availability up and limited rent growth opportunities.
Looking ahead to the rest of 2024, challenges remain but there is also reason for optimism. Apartment demand has been trending the right way for a year now. So, at least through the third quarter, the industry should see continued improvement there. The labor market remains strong and that should continue to mitigate the risk from the eroded state of household finances for as long as the labor market holds.
However, there are definite cracks emerging. Uniquely among price classes, Class A net absorption fell in the quarter relative to last year. The labor market remains tight, but more than 200,000 additional people have been added to the ranks of multiple jobholders nationally in just the last two months. Inflation has come down from its peak but rose slightly in March and has put the potential for rate cuts in the near term into question.
One certainty for multifamily is that new supply will not be slowing. The first quarter was largely positive, but much else remains uncertain.
The Key to Data-Driven Decisions
Unlock unparalleled insights with our comprehensive platforms. Schedule your personalized demo and witness the power of accurate, reliable multifamily data today!
Disclaimer: All content and information within this article is for informational purposes only. ALN Apartment Data makes no representation as to the accuracy or completeness of any information in this or any other article posted on this site or found by following any link on this site. The owner will not be held liable for any losses, injuries, or damages from the display or use of this information. All content and information in this article may be shared provided a link to the article or website is included in the shared content.