Mid-Year Multifamily Review
Amazingly enough, we are already in the back half of 2022. Both 2020 and 2021 were full of ups, downs, and historic movement across industry metrics. So far, 2022 is stacking up similarly and has resembled almost a hybrid of the two previous years. On the one hand, national average effective rent growth has already outpaced a typical pre-pandemic year – a development very much like last year.
On the other hand, apartment demand has not only receded from last year’s dizzying peak but has fallen short of any recent year with the exception of 2020. After the initial shock in the first half of 2020 from the COVID-19 pandemic, apartment demand rebounded in the second half of the year, though, without accompanying rent growth.
In 2021, the demand surge continued and intensified, sending average effective rent growth to a stratospheric level. So far in 2022, lackluster net absorption has been the most dramatic development, but it did not lead to a significant cooling off in rent growth in the first half of the year.
As always, all numbers will refer to conventional properties of at least 50 units.
View the full monthly Markets Stats PDF
New Supply and Net Absorption
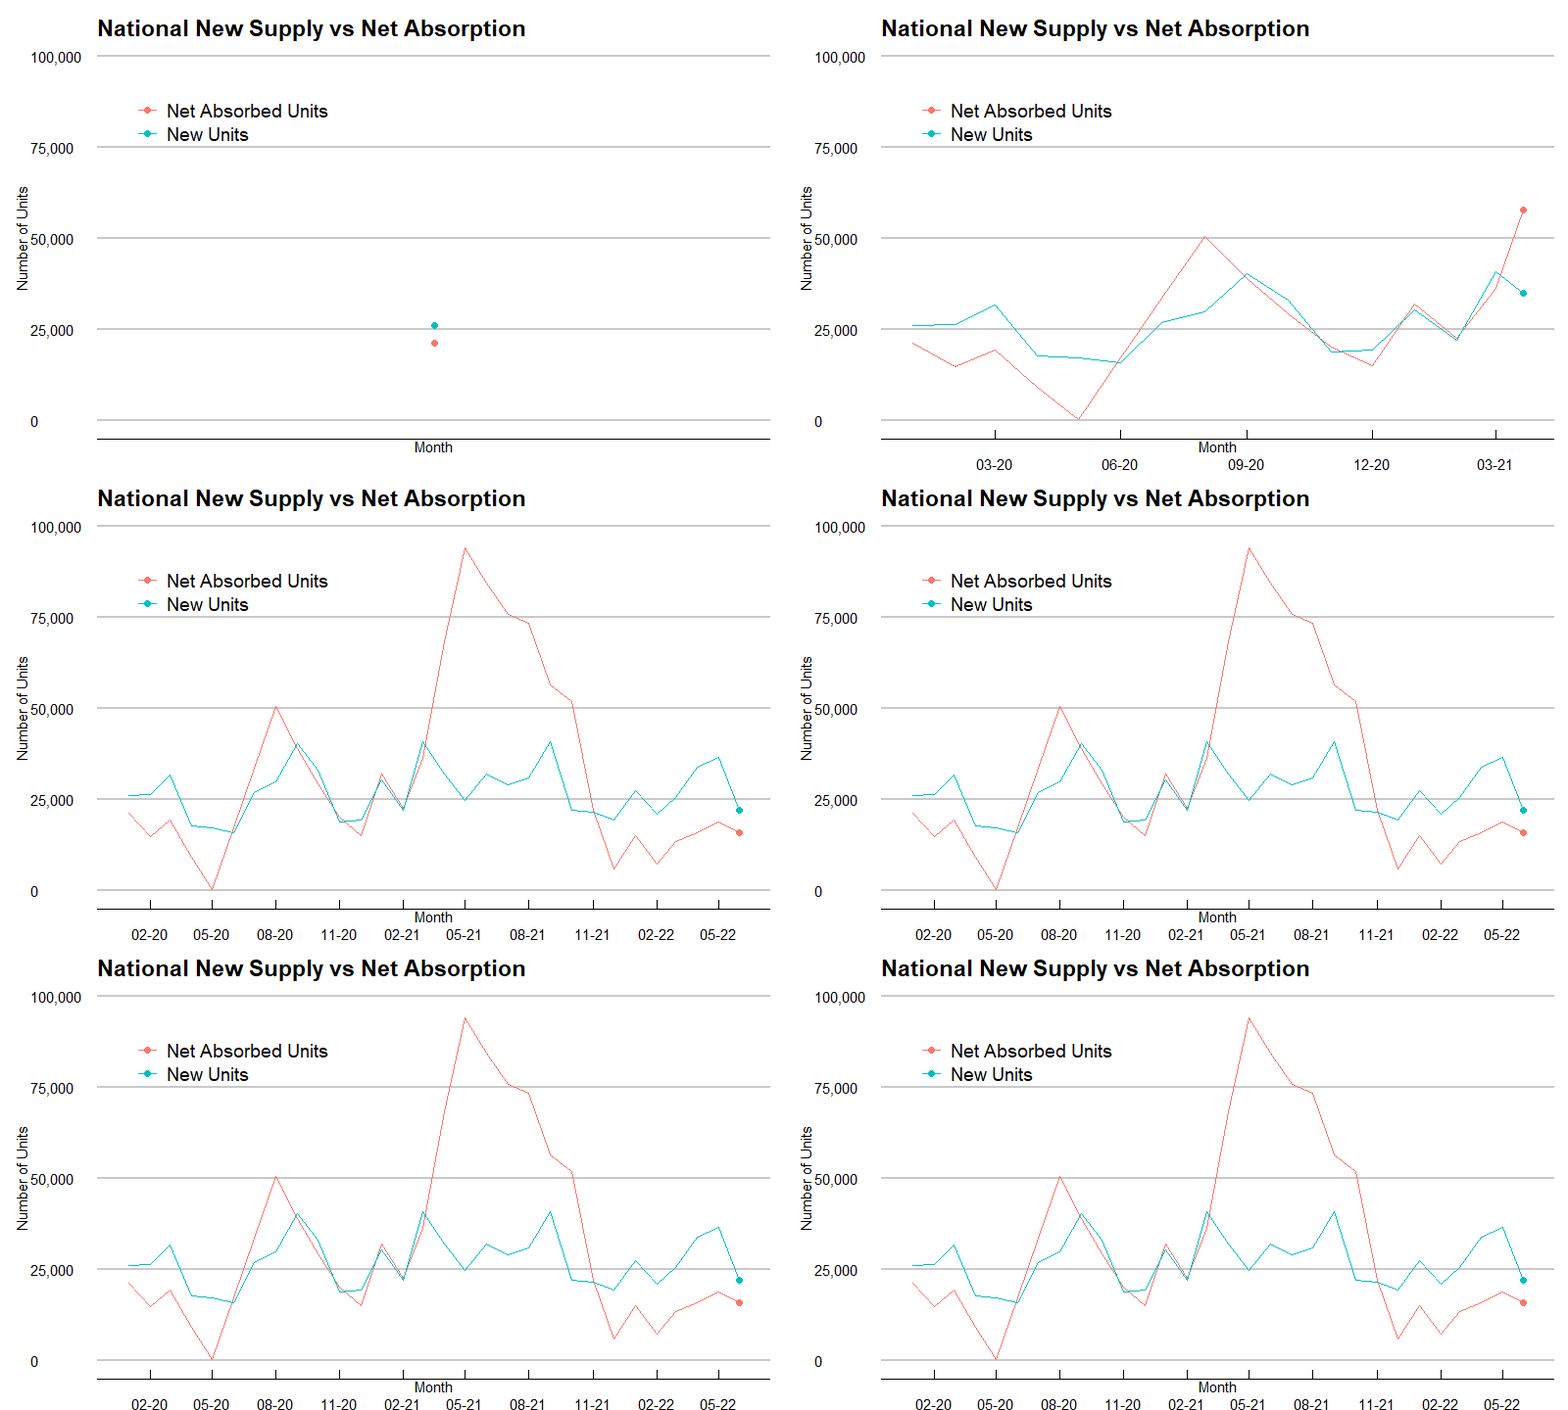
New supply, while down some from the same portion of last year, has so far this year been right in the range established over the last five years despite continued development challenges. About 170,000 new units have been delivered through June, second-most in the last five years. Usual suspects such as Dallas – Fort Worth, New York, and Houston populate the top of the list for new supply in the period but rounding out the top five are two markets not usually so high up the list – Phoenix and Tampa.

The biggest headline so far this year has been the change in apartment demand. Last year was an outlier, to be sure, but the shortfall in net absorbed units this year compared to the first half of last year has been 75%. In the last five years, only 2020 had failed to reach at least 200,000 net absorbed units by the end of June — until this year that is.
A little less than 90,000 net absorbed units so far this year barely surpassed the approximately 81,000 net units from 2020 – a year in which March through May were significantly negatively impacted by the pandemic. The effect of this supply/demand dynamic has been a loss in national average occupancy of just less than 1%.
Average occupancy still closed at the highest point of any recent June at more than 93% thanks to last year’s run up, but this year joined 2020 as the only two years in the last five to lose average occupancy ground through the first half of the year. The downward slide in apartment demand has been fairly consistent across the board, but the pain has been most acute in the Class C and Class D subsets as well as within properties to enter the year already stabilized.
Average Effective Rent and Lease Concessions
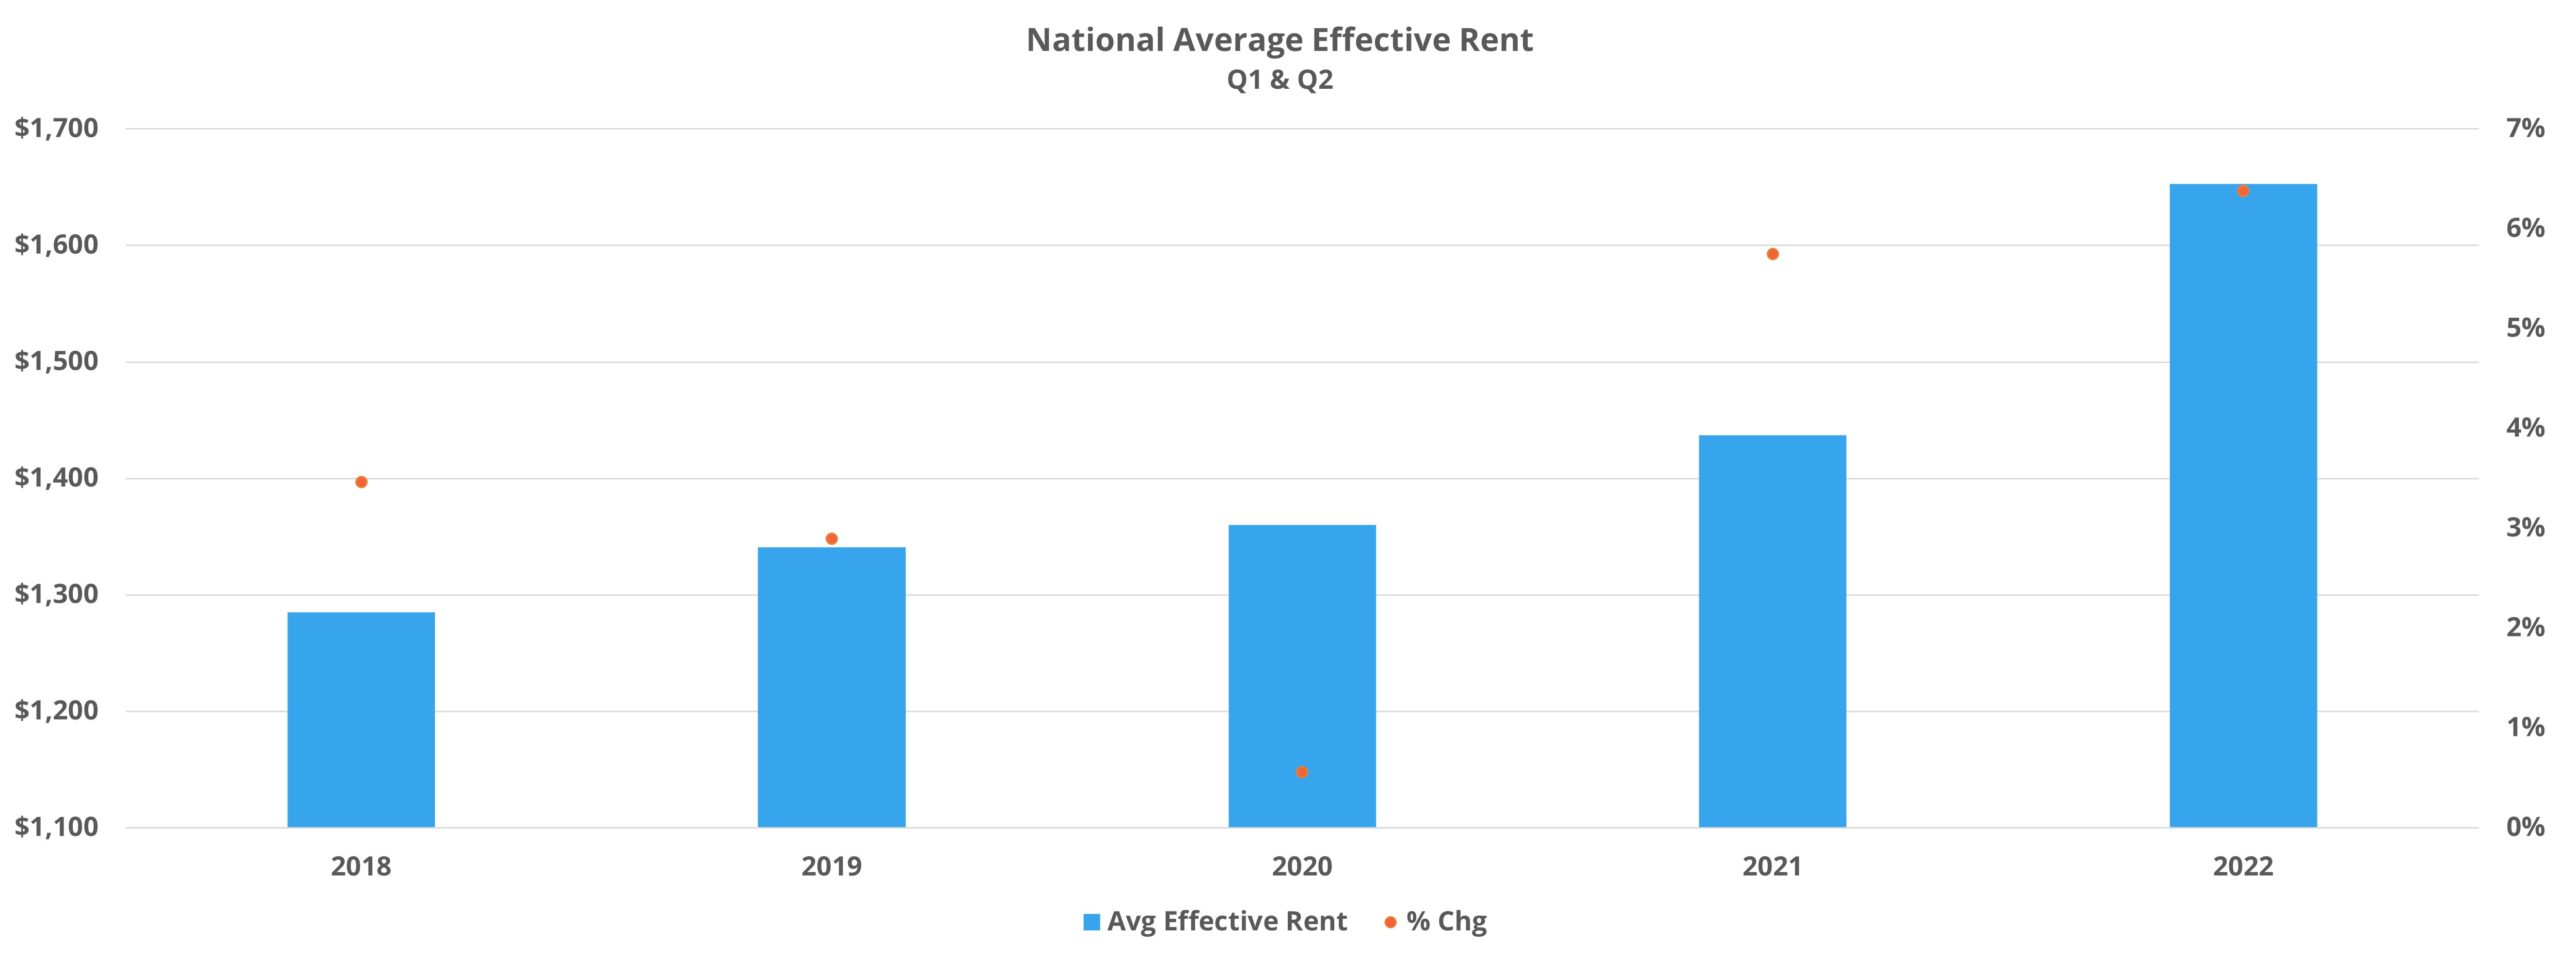
Despite tepid net absorption, average effective rent for new leases in the first half of the year outpaced even last year. At more than 6%, the growth was well above anything from the 2018 through 2020 period. One caveat for the comparison to last year would be that rent growth did not begin in earnest until the end of Q1 2021 whereas in 2022 the rent growth began during the first quarter. As a result, rent growth this year in just the second quarter was lower than last year.

Lease concession availability has not yet begun to increase. An almost 15% decline in availability from the start of the year meant that only around 7% of conventional properties ended June offering a discount for new leases. The average discount value, calculated only from properties offering a lease concession, fell by essentially the same amount to close the month at three weeks off an annual lease.
Notably, rent growth momentum in the period maintained its pace across the price classes. As already mentioned, Class D properties have shed net leased unit this year, and Class C marginally avoided that ignominious territory. However, thanks to average occupancy that remains higher than normal, rent growth this year has been stronger even than last year through June.
Change is Good
ALN OnLine is being completely redesigned and rebuilt for simplicity, speed, and even greater depth. We’ve also been redesigning our existing reports to better represent our data and brand identity, and more importantly, bring even more value to our clients. Find out more about what you can expect when we release the newest version of our flagship platform.
Market Notes
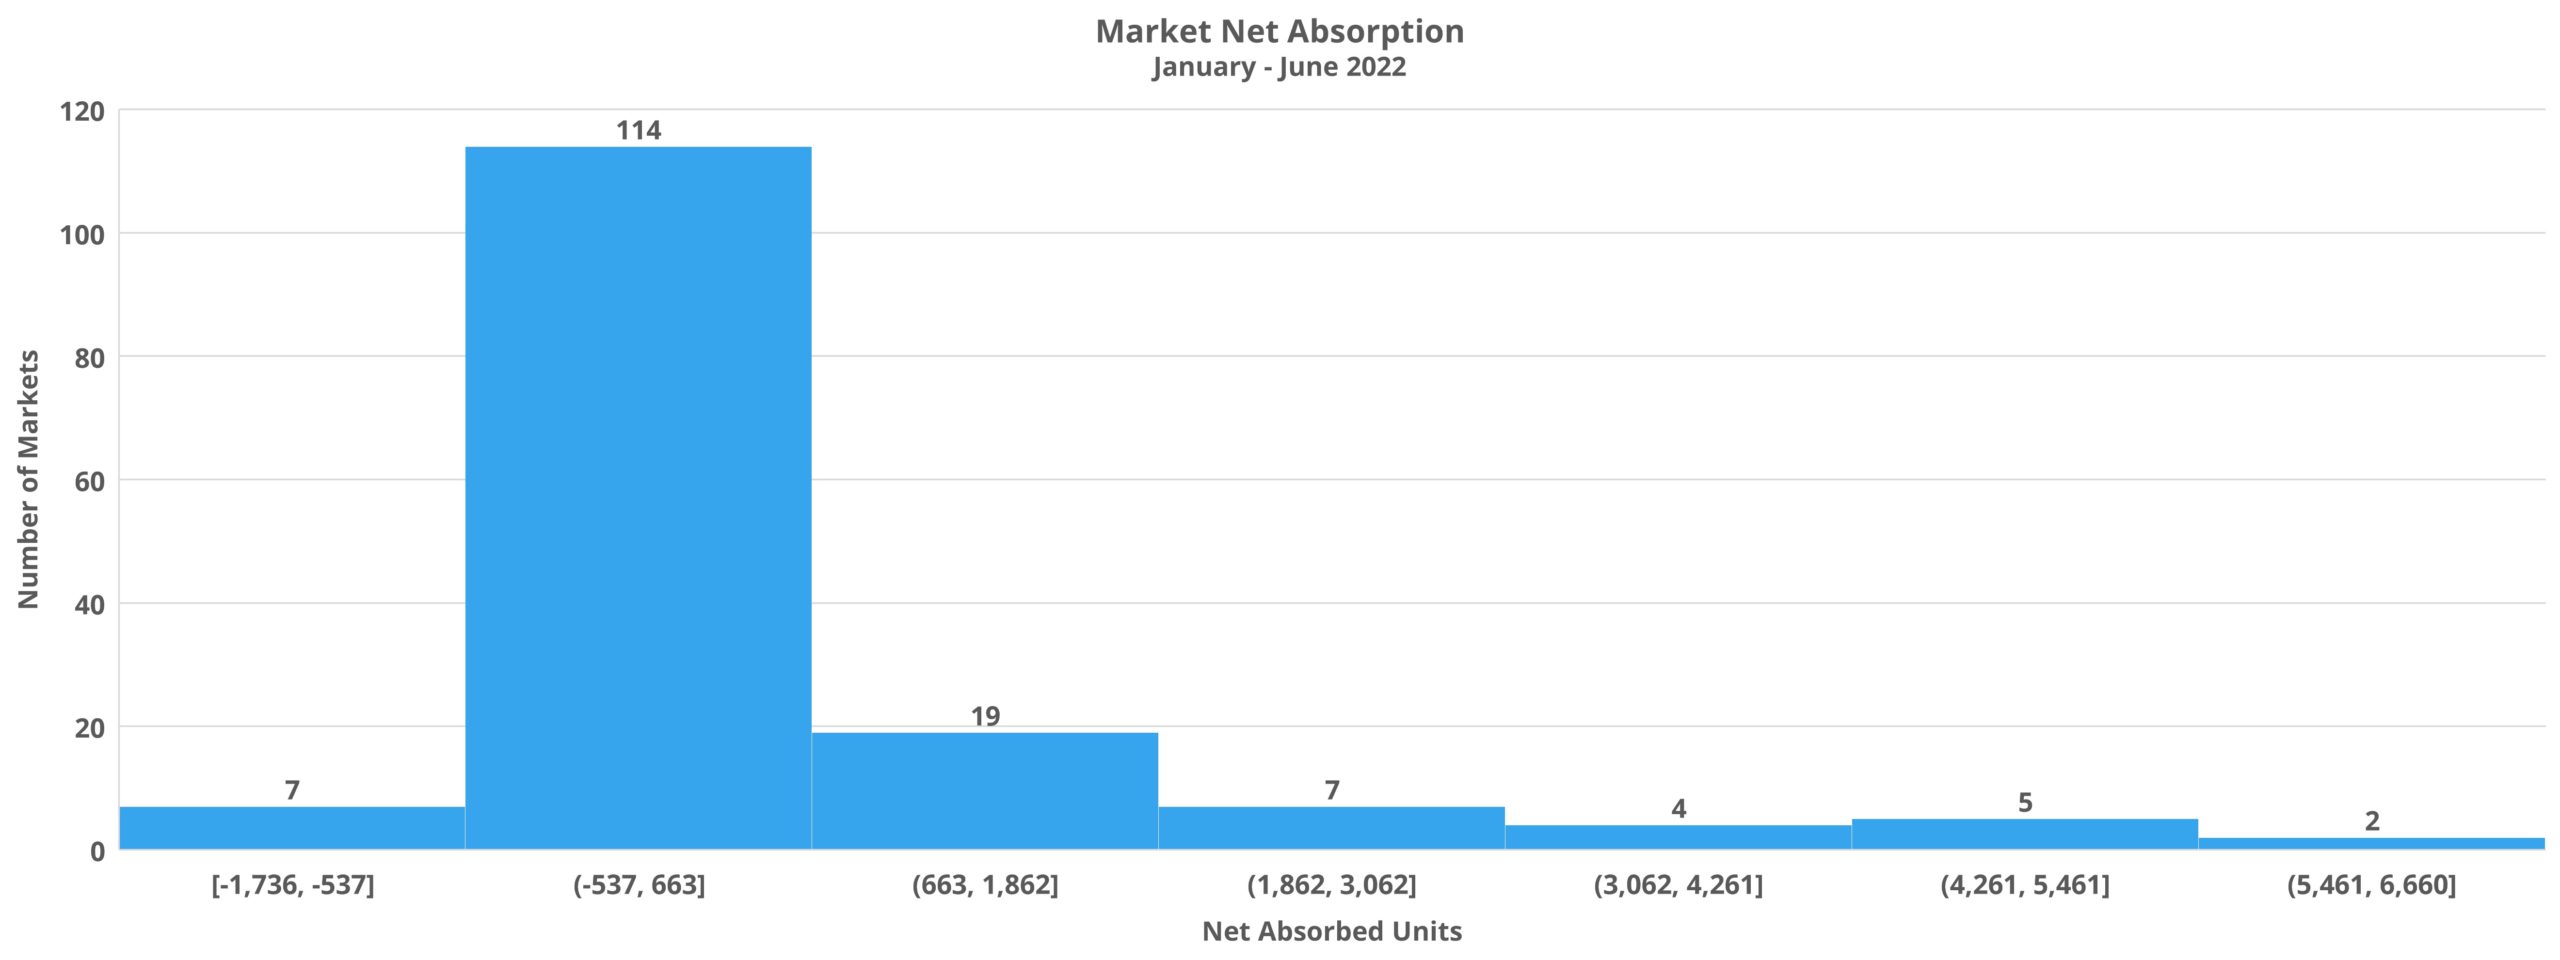
Unsurprisingly, the Dallas – Fort Worth market led the nation in net absorption with almost 6,700 net units absorbed through June. What was more unusual, especially compared to recent years, was San Francisco – Oakland, Chicago, and Washington DC sliding into the next spots. All three of these markets were among those especially impacted during the pandemic era and were slower to join the bounce back party last year.
On the other end of the spectrum, around 50 markets suffered a net loss in leased units through June. Most were tertiary markets or smaller secondary markets, but larger markets like Atlanta, Phoenix, and San Antonio stood out. San Bernardino – Riverside was also notable in the negative category because it had been one of the strongest performing areas of California over the last few years.

Only one state had more than one market among the top ten in average effective rent growth for the first half of the year. That state was Florida, and four markets across the state landed in the top 10 nationally. Fort Myers – Naples led the way with a 14% gain, but Miami, Fort Lauderdale, and Orlando were also in the top ten. Tampa, one of the national leaders in rent growth last year, has fallen out of the top 20 markets so far this year.
The other areas near the top of the rent growth list were smaller markets such as Myrtle Beach, Anchorage, Midland – Odessa, and Knoxville. The markets near the bottom of the rent growth rankings were almost exclusively tertiary markets, with the exceptions of Baltimore and Minneapolis – St. Paul which each gained about 3.5%.
Takeaways
Much has changed since last year, both within the multifamily industry and without. The economic outlook has certainly shifted, as has the financial status of many renter households across the country with the expiration of various pandemic response measures and the prolonged inflation issue. Rising interest rates cannot be overlooked as an influencing factor looking ahead, particularly the impact on the volume of units in the construction pipeline and how changes to single-family prices and inventory will affect multifamily demand.
One aspect that has yet to change has been rent growth. Anecdotally it seems that, at least in some markets, dynamics are beginning to change: less renewal increases being captured and a move back toward lease concessions in some cases. It seems likely looking ahead to the second half of the year that without a significant improvement in net absorption, the new construction pipeline will continue to guide national average occupancy on its shallow downward trajectory.
In a few months’ time the industry may find itself facing sustained lackluster demand but without the built-in advantage of the unusually low vacancies that the year opened with. It is hard to see rent growth momentum surviving unscathed beyond that point.
Disclaimer: All content and information within this article is for informational purposes only. ALN Apartment Data makes no representation as to the accuracy or completeness of any information in this or any other article posted on this site or found by following any link on this site. The owner will not be held liable for any losses, injuries, or damages from the display or use of this information. All content and information in this article may be shared provided a link to the article or website is included in the shared content.

