Market Spotlight: Greater Phoenix
The holiday season is in full swing and the end of 2019 is quickly approaching. Let’s take the opportunity to check-in on a market with some interesting recent activity – the Greater Phoenix area. Mirroring the US Census Bureau, the ALN Phoenix market also includes the Mesa and Scottsdale areas.
For our purposes here, only conventional properties with at least 50 units will be included.
View the full monthly Markets Stats PDF
New Units and Net Absorption
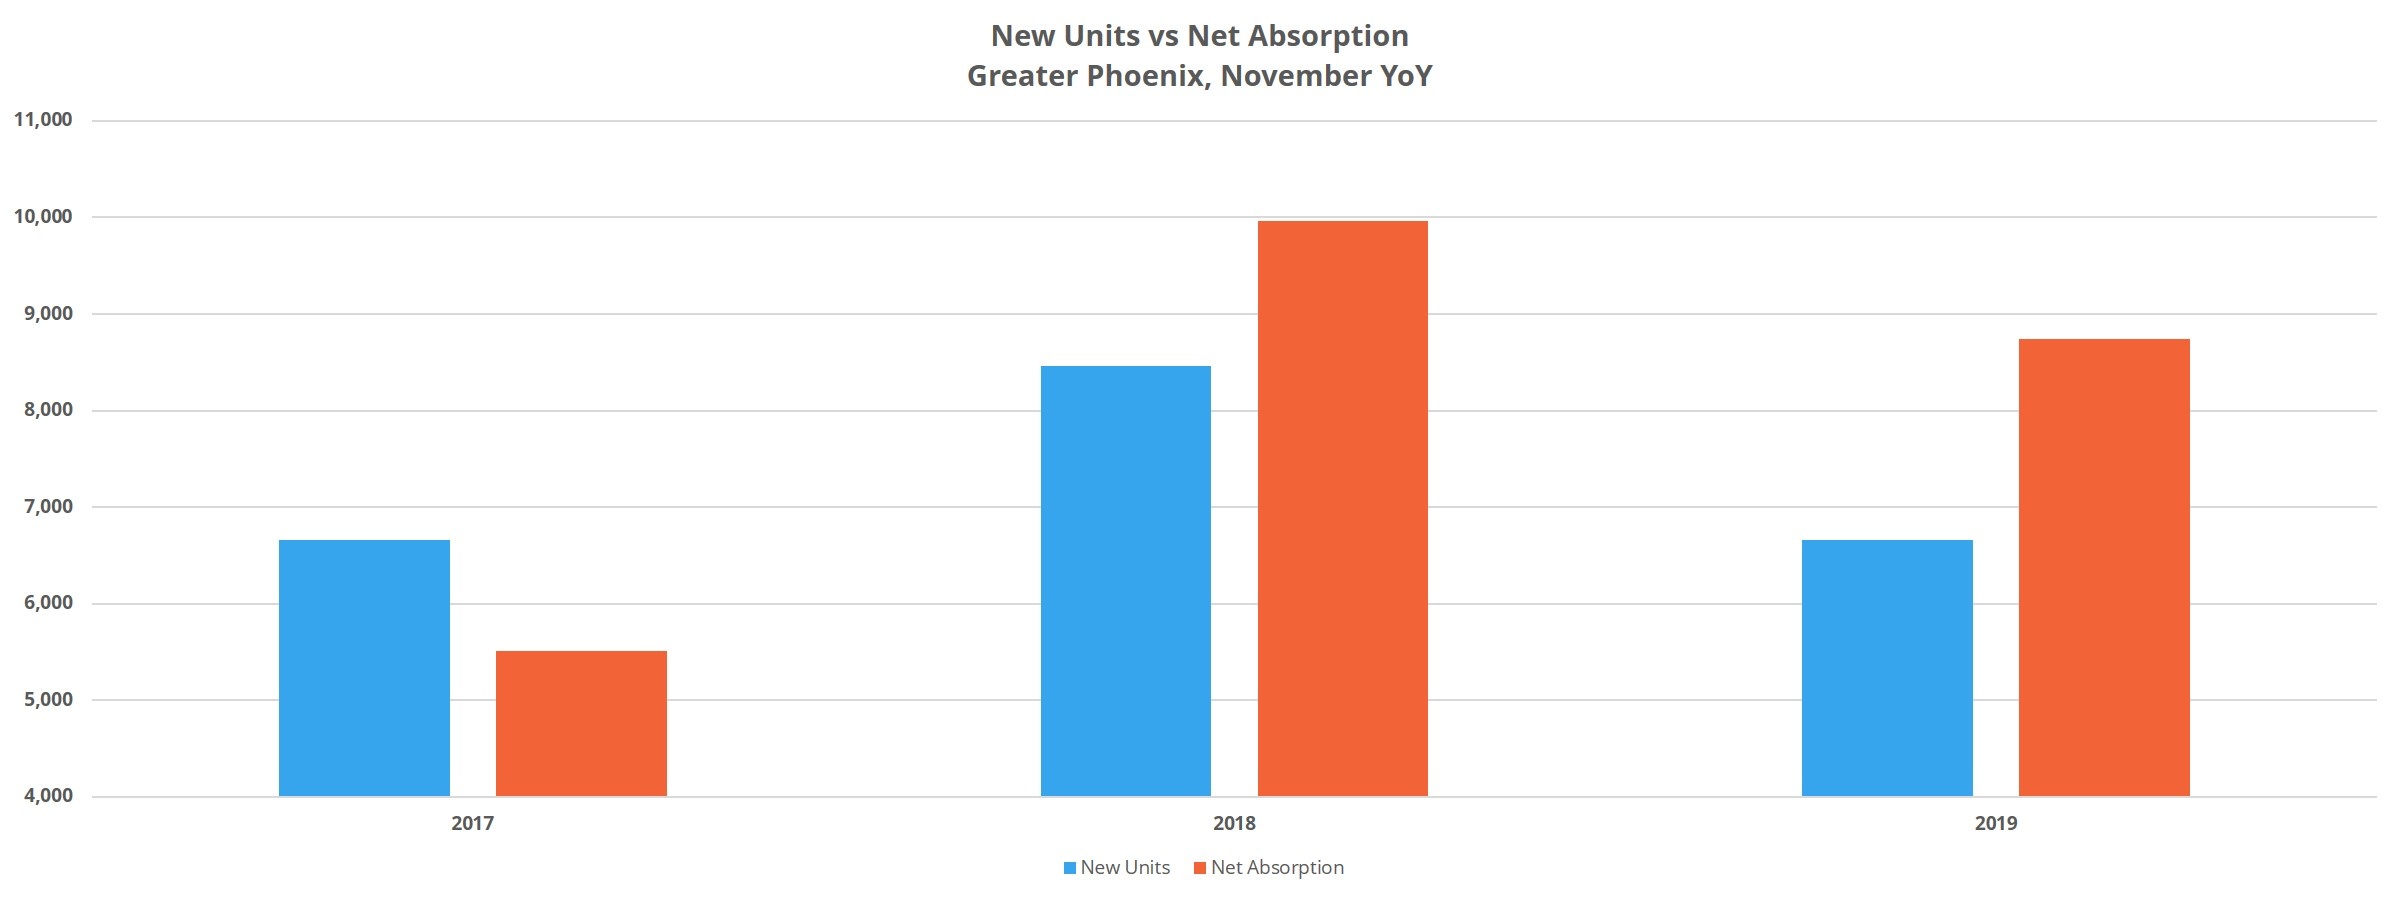
Almost 7,000 new units have been delivered in the last 12 months in Phoenix. That represents a slight reduction from the annual period from November 2017 to November 2018 when about 8,500 new units were added. Net absorption* of nearly 8,700 units in the last year was more than enough to outpace the new supply despite that figure marking a reduction from approximately 10,000 newly rented units from the previous annual period. Looking back over the last 36 months, absorbed units have exceeded new units delivered by about 2,500 units.
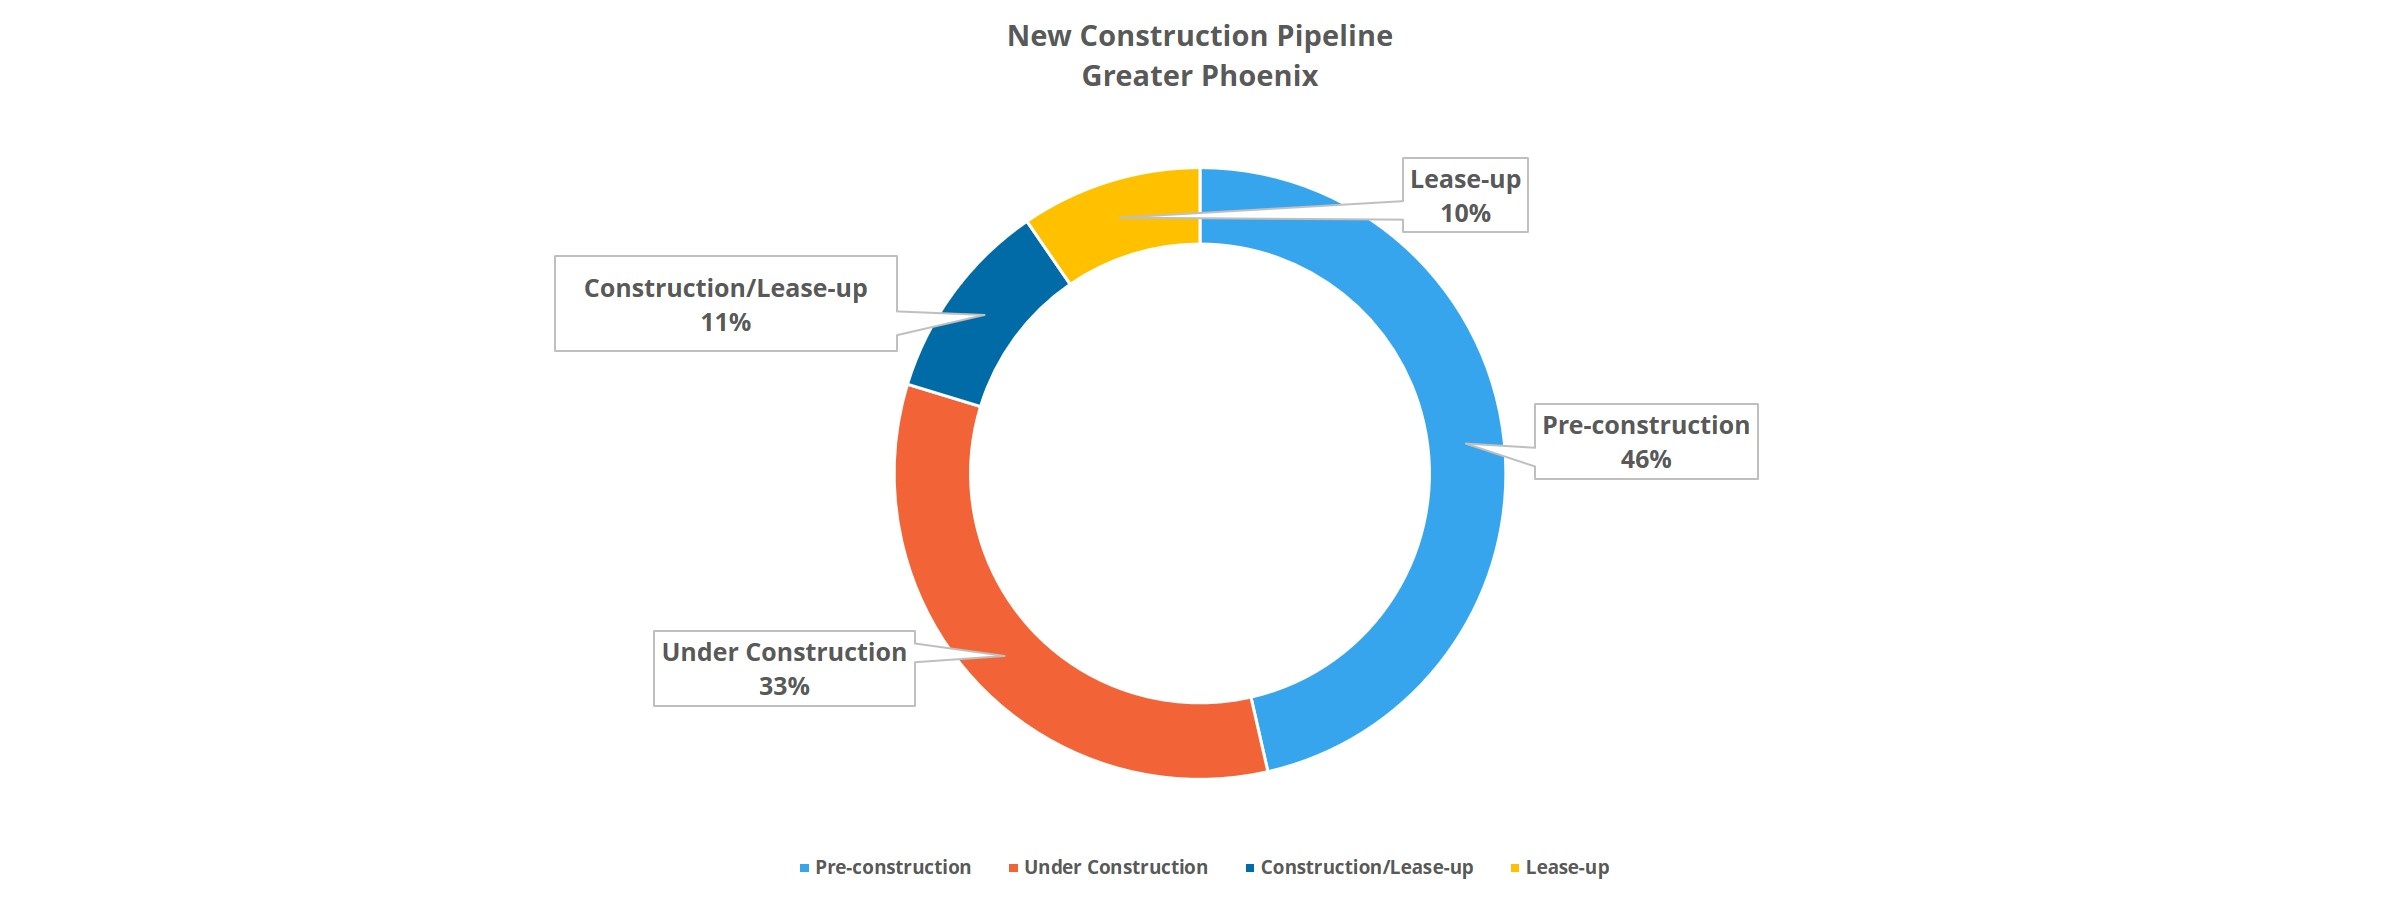
Looking ahead at the new construction pipeline, we expect roughly another 22,000 units to be delivered within the next 18 to 24 months. These are properties already under construction to varying degrees and reflect a near-term uptick in new construction activity as compared to the last few years. Beyond that, there are another 19,000 units in a pre-construction phase. These units account for 46% of the overall pipeline and add some helpful flexibility for decision-makers as they monitor how the market responds to the deliveries.

Average Occupancy Change
Thanks to demand continuing to outpace new supply, average occupancy managed a 40-basis point annual improvement to end November at just above 93%. This gain doesn’t quite stack up to the previous annual gain of 75 basis points but marks a clear improvement from the 60-basis point loss from November 2016 to November 2017.
The two submarkets with the most new construction activity are predictably a little behind the rest of the market in average occupancy. The ASU area has added more than 1,400 new units in the past 12 months while net absorption has only been about 1,100 units. The Downtown Phoenix submarket has added more than 900 new units in the same period while managing less than 600 newly rented units. As a result, average occupancy in the two areas ended November at 89% and 84% respectively.
On the other side of the coin, the Far North Phoenix region has seen a 3% occupancy improvement to 95% in a year with negligible new supply. Likewise, South Scottsdale realized an average occupancy gain of more than 4% finishing the month just shy of 96%.

Average Effective Rent Growth & Rent Concessions
Rents continue to perform well in this market. In the past 12 months, average effective rent has gained 9% to end November at just under $1,200 per unit. This appreciation surpassed that of the previous annual period, which saw rents climb a respectable 8%. All told, in the last 36 months, average effective rent has risen almost 19%. Despite Arizona being a little slower to come out of the previous downturn, given the long-toothed nature of the current cycle, these gains are impressive.
Part of the reason for improving rent gains is the reduction in rent concessions. This is an especially welcome sight in the face of an active construction pipeline. About 17% of properties in the Greater Phoenix market are currently offering a discount, down from 20% to end November 2018. Looking back to November of 2016 26% of conventional properties were offering a discount, so the 17% of properties currently offering represents a significant draw-down.
Of those properties offering a concession package, the average value of the discount declined slightly over the past 12 months. The average discount now stands at just above 4%, or about 2.4 weeks off a 12-month lease.
Final Takeaways
Overall, the multifamily industry has experienced another strong year in the Greater Phoenix area. Despite continued new construction activity, average occupancy remains comfortably above 90% thanks to strong demand. Average effective rent has been well above the average nationally and has only gotten stronger compared to the last couple of year-over-year periods. As we look to 2020 and beyond, the storyline to watch for this market is how well it continues to absorb the new units we know are on the way.
Disclaimer: All content and information within this article is for informational purposes only. ALN Apartment Data, Inc. makes no representation as to the accuracy or completeness of any information in this or any other article posted on this site or found by following any link on this site. The owner will not be held liable for any losses, injuries, or damages from the display or use of this information. All content and information in this article may be shared provided a link to the article or website is included in the shared content.

