
It’s Raining New Units in Multifamily
In numerous ALN blog posts and previous newsletters over the last handful of months a recurring comment has been that as more typical seasonal trends reemerge in the multifamily sector, an early signpost for 2023 performance will be to what extent a spring and summer demand bounce materializes this year. During 2020 and 2021, the usual seasonal ebb and flow of multifamily demand was interrupted by exogenous events. In 2022, some normalcy began to reappear, but the uptick in net absorption in the spring and summer was less pronounced and shorter lived than in prior years.
This year, the first quarter provided something of a mixed bag for the industry. After months of consecutive negative net absorption at the national level, March broke the streak at seven months. March is a bit of a bridge between the slower winter period and the more active spring months for the apartment industry. So, improvement in March did constitute a positive data point as the year continues to unfold.
With all of this in mind, it is time to have a look at how the first quarter played out. All numbers will refer to conventional properties of at least 50 units.
View the full monthly Markets Stats PDF
New Units and Net Absorption
Other developments in the first three months of the new year were notable to be sure, but the headline number of the first quarter was arguably new units delivered. About 109,000 units were added across the country in the period. This level of new supply was 40% higher than in the same portion of 2022 and 25% higher than the three-year average for the first quarter.
The increase in deliveries was widespread, with the largest jump from the first quarter of last year on a percentage basis occurring in tertiary markets. Even so, three primary markets were in a category of their own. Dallas – Fort Worth added around 6,300 new units. Los Angeles – Orange County added approximately 6,200 new units and about 5,800 new units were delivered in Phoenix.
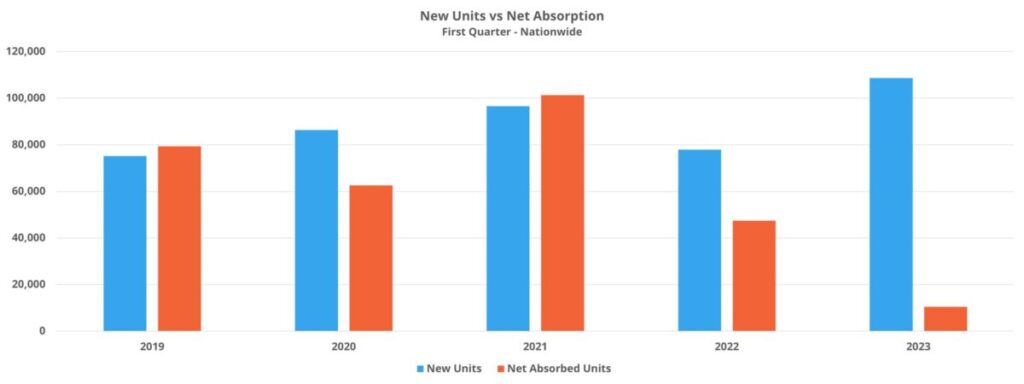
As already mentioned, national net absorption in March was in positive territory for the first time since last summer. Despite that positive development, first quarter net absorption was significantly lower than usual for this time of year. More than 10,000 net units were absorbed in the period. However, the previous low point in recent years for an opening quarter was last year’s approximately 48,000 net absorbed units.
Apartment demand was lower across the price classes to begin 2023, but the challenges continue to be especially present in the workforce housing segments. Class C and Class D net absorption were both negative in the period. Class D was worst-hit and shed about 11,000 net leased units in the first three months of the year.
The net effect of significantly higher deliveries and stubbornly tepid apartment demand was an average occupancy decline of 0.8% nationally down to just under 91% to end March. In 2019, 2020, and 2021, national average occupancy ended March almost exactly 100 basis points higher.
Average Effective Rent and Lease Concessions
After running hot for a full eighteen months, multifamily rent growth finally cooled in the back half of 2022. It also remained lower in the first quarter of this year. A 0.5% gain in average effective rent for new leases brought the average unit to $1,684 per month nationally. That average was more than $300 per month higher than just 24 months ago.
Rent growth was more robust in the smaller secondary markets and in tertiary markets. Average effective rent growth for each of those two groups of markets exceeded 1% in the period. Meanwhile, primary markets gained only 0.3% as a group and the larger secondary markets gained 0.8%.
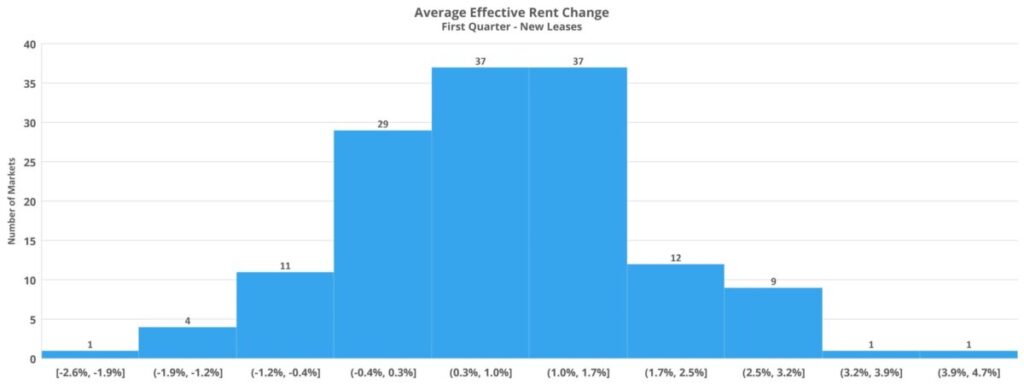
At the market level, four areas averaged at least 1% effective rent growth per month. Columbia, Missouri gained 4% at the average during the quarter, while Augusta – Portland, ME, Midland – Odessa, TX, and Myrtle Beach each gained just above 3%. There were 25 markets in which the average effective rent declined in the quarter. Of those, the hardest hit was Honolulu which suffered a nearly 3% decline. Boise and South Bend, IN each suffered a decline of approximately 2% in average effective rent for new leases.
After lease concession availability plummeted in 2021 and remained low in 2022, the trend has been slowly reversing in recent months. A double-digit increase in availability in the quarter brought the share of conventional properties offering a discount for new leases to just under 15%. This level of availability was still slightly below the pre-pandemic norm, but that delta will likely be fully eliminated in the coming months.
Takeaways
Within the context of the current less-than-ideal environment, the first quarter can reasonably be characterized as more positive than negative for the multifamily industry. While it is true that apartment demand remains elusive, the month of March at least provided an indication that a seasonal bounce in net absorption may yet materialize this year.
Rent growth was much lower in the quarter than in any recent year. Rent change at least entered positive territory, though, and lower rent growth this year would go a long way to helping the industry regain some balance after the double-digit annual growth of the last two years.
However, at least two near-term risks remain. One is, of course, the broader macroeconomic situation. Inflation remains stubborn, particularly for more commonly occurring purchases such as food and fuel. The labor market remains tight, but cracks have emerged. In an ever-more connected economy, geopolitical uncertainty effects all aspects of the industry.
Another near-term risk is multifamily supply. First quarter deliveries were not an anomaly. This year is expected to be a very active year for multifamily supply – continuing a trend of annual increases in new supply dating back to the middle of last decade. These are ultimately necessary units in what is generally considered to be a chronically undersupplied U.S. housing market, but there will be some bumps in the road in the short term. It will be important to see improvement in demand in the middle quarters of 2023. Even if that improvement occurs there will still likely be pressure on occupancy from the construction pipeline this year.
As the calendar moves toward mid-year, inflation, employment, and the balance between net absorbed units versus new units delivered will be worthy of focus.
Disclaimer: All content and information within this article is for informational purposes only. ALN Apartment Data makes no representation as to the accuracy or completeness of any information in this or any other article posted on this site or found by following any link on this site. The owner will not be held liable for any losses, injuries, or damages from the display or use of this information. All content and information in this article may be shared provided a link to the article or website is included in the shared content.