

Exploring Gateway and Sunbelt Multifamily Performance
As the multifamily recovery got underway in 2021 after a rocky 2020, Sunbelt markets led the way in both apartment demand and rent growth. Reasons for this included migration trends, relative affordability, and generally earlier economic re-openings from the pandemic. International Gateway markets like Boston, Los Angeles, et cetera were certainly not left out of the industry bounce back, but in most cases the recovery in those areas began later and did not reach quite the same heights.
As industry performance cooled in 2022 and has remained more muted in early 2023, it has been some of the Sunbelt markets that have led the declines in demand and rent growth during this correction period. With all of this in mind, this month’s newsletter will focus on a comparison of Gateway markets as a group and Sunbelt markets as a group and how those two subsets of markets have fared over the last three months – December through February.
Because the performance statistics for the group of all Sunbelt markets and the group of just primary Sunbelt markets were very close, and because a recent blog post detailed some of the dynamics of smaller market performance this winter, Gateway markets will here be compared to primary Sunbelt markets. Houston is often considered a Gateway market, but not ubiquitously, so for this month’s newsletter it will be in the Sunbelt group. Miami, which could also be in either group, will be included as a Gateway market.
As always, only conventional properties of at least 50 units will be included.
View the full monthly Markets Stats PDF
Recent Sunbelt vs Gateway Performance
Overall average occupancy for Gateway markets fell 0.6% over the last three months to finish February just above 91% – roughly 100 basis points below the pre-pandemic level from February 2020. Chicago, Los Angeles – Orange County, and New York City each saw average occupancy decline by about 1% from December through February. A 20-basis point gain in both Miami and San Francisco – Oakland were the only increases among Gateway markets in the period.
For the group of primary Sunbelt markets, average occupancy fell by 0.9% in the last three months to finish February at 90%. As with the Gateway markets group, this average occupancy was about 100 basis points below the pre-pandemic level from February 2020. None of the Sunbelt markets managed to add to average occupancy in the period and decline of approximately 2% put Orlando in a class of its own. Other areas with above-average declines included Austin, Nashville, and San Antonio with losses of about 1.5% each.
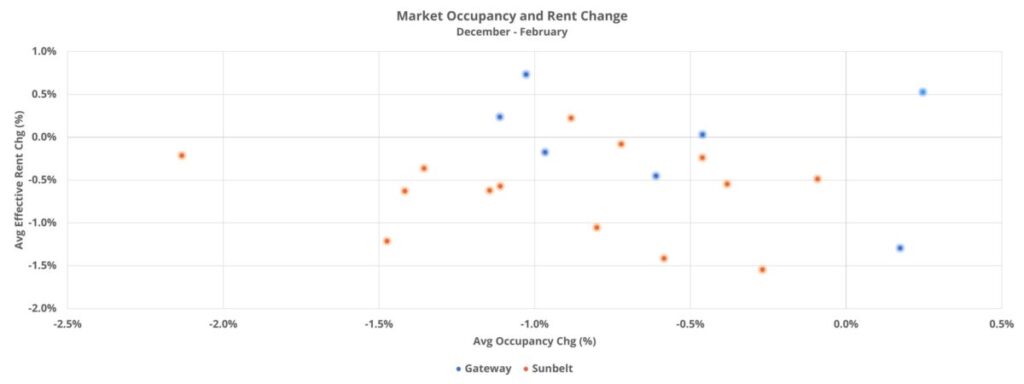
The larger difference in performance between Gateway and Sunbelt markets in recent months has been on the rent front. Average effective rent for new leases for the group of Gateway markets declined by 0.1% in the period to finish at about $2,540 per month at the average. Boston, Chicago, Miami, and New York each managed to avoid a loss in average effective rent – led by a 0.7% increase for Chicago and a 0.5% gain in Miami. On the other side of the coin, San Francisco – Oakland suffered the largest average rent decline with a 1.4% slide.
For the Sunbelt group, a 0.7% decline brought the average effective rent for new residents to $1,685 – illustrating the substantial gap in average rent relative to Gateway markets despite the rent growth of the last couple of years. Only Houston managed a rent gain in the period for this group, and a paltry 0.2% gain at that. Austin, Phoenix, and Las Vegas, each with an average effective rent decrease of around 1.5%, led the way among Sunbelt markets in average rent declines.
New Units as Share of Existing Stock
Overall new supply totals are certainly useful, but more useful when making comparisons across markets or groups of markets is new units as a share of existing stock. This both controls for differences in size and gives more context around the relative volume of supply.
About 15,000 new units delivered across Gateway markets in the last three months equaled 0.6% of existing stock. There was not much variance between the markets in this group. Boston, Chicago, and Miami had the highest adjusted volume of new supply with new units totaling approximately 0.8% of existing stock in each market. On the low end, San Francisco – Oakland had new supply equal to only 0.4% of existing stock.
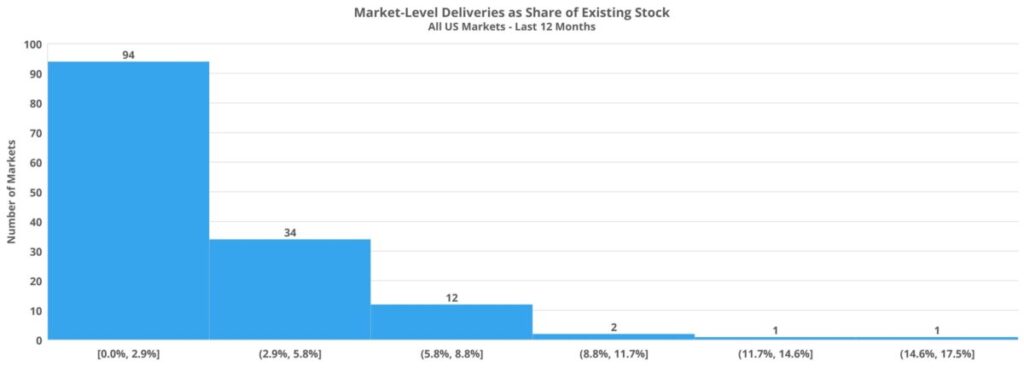
About 36,000 new units delivered across primary Sunbelt markets in the period represented 0.8% of existing stock in that group – slightly higher than in Gateway markets. On the high end, about 4,800 new units delivered in Orlando represented almost 2.5% of existing stock, while Austin and Nashville saw deliveries equaling around 1.5% of market capacity. On the low end, San Bernardino – Riverside and San Diego each had new supply totaling only 0.2% of multifamily stock.
Net Absorption
For Gateway markets, net absorption in the last three months totaled a net loss of just more than 1,800 leased units. Compared to rent growth performance at the market level, the last three months have delivered much more disparate results in net absorption. For example, in San Francisco – Oakland and Miami, net absorption equaled about 1,700 and 1,000 units respectively. On the other end of the spectrum, New York suffered a net loss of nearly 3,500 leased units and the decrease in Los Angeles – Orange County was nearly 1,300 net units.
For primary Sunbelt markets, a net loss of around 3,300 leased units over the last three months was of a similar magnitude to the Gateway markets when accounting for the difference in the number of total units in the two baskets of markets. On the positive side, net absorption in Phoenix topped 2,300 units and Tampa managed a net gain of almost 1,600 leased units. Dallas – Fort Worth led the way in declines with a net loss of approximately 2,600 leased units. Atlanta also struggled with a decline of just more than 1,800 leased units and both Houston and San Antonio lost around 1,300 leased units each.
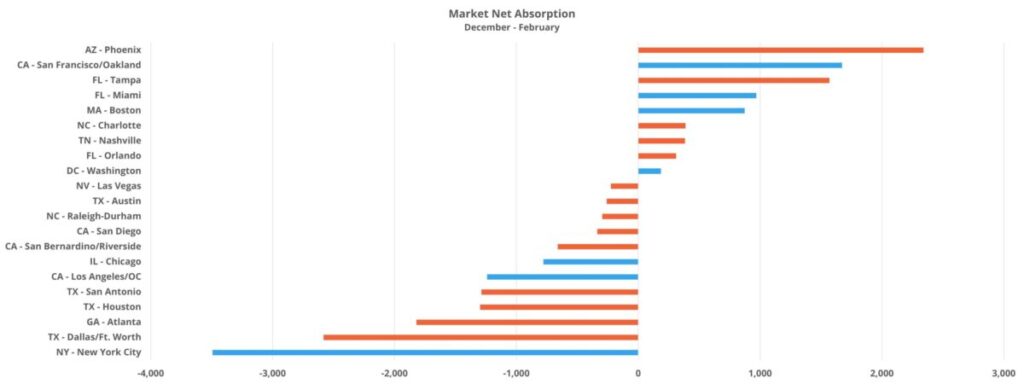
Comparing the two groups of markets, 57% of the Gateway markets managed positive net absorption in the three-month period while only 36% of Sunbelt markets did the same.
Takeaways
National average occupancy, average effective rent, and net absorption have all been negative over the last three months. However, developments have played out differently across Gateway and Sunbelt markets.
Average occupancy and average effective rent declines have been slightly less acute for Gateway markets as a group than for the group of primary Sunbelt markets. Apartment demand performance has been similar between the two groups once adjusted for multifamily stock, but a higher volume of new supply has already begun to impact the Sunbelt.
The opportunities and challenges faced by Gateway markets and Sunbelt markets as 2023 progresses are likely to be somewhat different. While it is true that Sunbelt markets led the way in rent growth over the last couple of years, they did not lose ground in relative affordability. This was due both to the rent growth Gateway markets saw as well as the already significantly higher rents in those markets. As a result, most Sunbelt markets still enjoy an affordability advantage over Gateway markets and have more positive migration trends. The more particular headwind for many Sunbelt markets in the near-term is likely to be new supply pressure.
In addition to affordability and migration challenges, the layoffs that have occurred across some of the largest firms in the finance and tech sectors have, so far, generally been more concentrated in Gateway markets. Should the employment picture soften considerably in the face of Fed policy and other challenges, layoffs would become more of an issue for areas outside of Gateway markets. Lastly, although Miami, New York and the California Bay Area rank in the top ten of primary markets in terms of construction pipeline units adjusted for existing market stock, no other Gateway market does. This year, that should be a help for multifamily performance.
Disclaimer: All content and information within this article is for informational purposes only. ALN Apartment Data makes no representation as to the accuracy or completeness of any information in this or any other article posted on this site or found by following any link on this site. The owner will not be held liable for any losses, injuries, or damages from the display or use of this information. All content and information in this article may be shared provided a link to the article or website is included in the shared content.