Setting Expectations for 2025 Multifamily Performance
2024 was a key step in the right direction for the multifamily industry. In the face of historic new supply pressure, the decline in national average occupancy was smaller than in 2022 or 2023. Net absorption showed robust annual improvement for a second straight year. Average effective rent growth for new leases more than doubled the lackluster 2023 total. Lease concession availability continued to rise, but at a much more modest pace than in 2022 or 2023.
However, further improvement is needed. Overall national average occupancy ended 2024 at its lowest point in years. Occupancy has been steadily declining for three years – and counting. Average effective rent growth last year, while better than in 2023, was still slightly below 3%. Despite significant improvement over the last two years, annual net absorption remained lower than in the years preceding the pandemic. This was despite national stock growing by about 2.3 million units in the last five years.
Note: All numbers refer to conventional properties of at least fifty units.
View the full monthly Markets Stats PDF
Expectations for New Supply in 2025
New supply will continue to play a prominent role in multifamily performance in 2025. Fewer new units are expected to be delivered this year than last. The margin between the two years is still somewhat up in the air. Expected lease dates can move around quite a bit even after a project is under construction.
ALN is currently tracking about 465,000 new units that are scheduled to begin leasing in 2025 and appear likely to do so based on trends in property construction duration. ALN is tracking more than 890,000 units that are currently under construction around the country. Should the rising average construction duration of the last few years begin to reverse this year, national new supply could top 600,000 conventional units in 2025 – slightly more than in 2024.
The decrease in multifamily permits and starts that were widely reported in 2024 will not begin to affect the industry until 2026 or 2027. One change that could materialize this year is a shift in regional deliveries activity.
Some Sunbelt markets that have been at the tip of the spear for new supply in recent years have seemingly already peaked for this cycle. Examples would be areas like Atlanta, Dallas – Fort Worth and Tampa. Other markets like Houston, San Antonio, Orlando, Austin, Las Vegas and Nashville may see a decline in annual deliveries this year, but by a slimmer margin.
While the Sunbelt may finally be set to take a much-needed step back, other regions of the country are likely to see an increase in new supply compared to recent years. In particular, Gateway markets like Los Angeles – Orange County, New York, and San Francisco – Oakland. However, numerous California markets appear poised for more supply. Examples include San Diego, Sacramento and San Bernardino – Riverside.

Household Formation and Composition
Household formation and composition are always important components within the apartment demand landscape. There is quite a bit of difference in the available data depending on source and methodology, but broad strokes are useful.
According to Census Bureau data, total household growth over the last three years was the strongest since 2014 through 2016 on a percentage basis. In the bigger picture, household formation has been falling for decades – both in percent change and in the number of households added. There is considerable uncertainty around potential household growth for next year, but something in the 0.5% to 1% range would be realistic.
Household composition can be more instructive for the multifamily demand outlook because it provides a more solid picture in some ways. Future household growth depends on myriad factors such as local, state, and federal policy actions, economic conditions, and demographic changes. Household composition on the other hand is simply a look at the make-up of current households. One section of recently released Census Bureau data is especially noteworthy here.
According to the data set, 57% of adults aged 18 to 24 lived with their parents in 2024. Another 16% of adults aged 25 to 34 did the same. The percentage for both was near the top of the range from the last few decades after receding a bit recently. The older cohort has especially seen some movement in recent years and is down nearly 200-basis points since 2020. These adults still living with parents, numbering more than twenty million, represent potential apartment demand given the right economic and affordability environment.
Let’s Talk About Multifamily Data for Your Business
Schedule a webinar to explore how you can get the exact multifamily data you need for your business this year
Apartment Demand Unlikely to Match New Supply
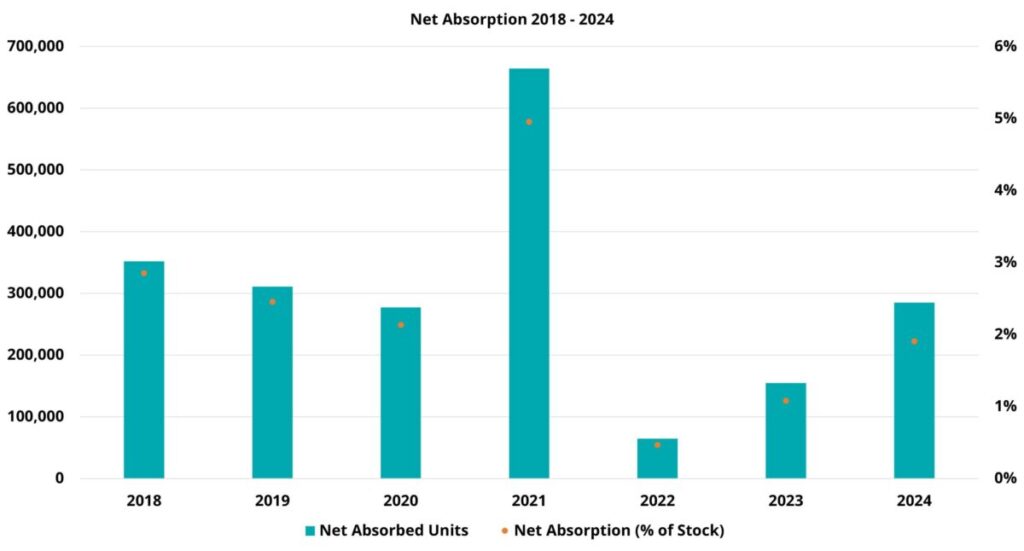
Apartment demand has shown substantial improvement in recent years. Net absorption in 2023 more than doubled a dismal 2022 total. Last year, net absorption rose by about 84% year-over-year to just over 285,000 units. This was still lower than any annual total from the pre-pandemic 2017 through 2019 period – and lower than in 2020 itself. Even so, demand last year was much better than in 2022. That year, fewer than 75,000 net units were absorbed nationally.
One of the encouraging aspects of recent apartment demand performance has been the broad-based improvement across price classes. The Class D subset was the last to turn the corner but appeared to do so last year. Looking ahead to 2025, further improvement in Class D demand would be the final piece of the puzzle to return the multifamily industry to pre-pandemic net absorption. In 2018, national net absorption was equal to approximately 2.9% of total conventional stock. In 2024, that figure was only about 1.9%.
Regionally, there is little reason to expect a change in the Sunbelt’s status as the locus of demand. According to the recently released U-Haul Growth Index for 2024, the top six states for incoming one-way U-Haul rentals were all in the Sunbelt. Two Mountain West states, Idaho and Utah, also remained in the top ten. These have been high-growth areas for multifamily in recent years. While portions of the Mountain West have begun to cool, Boise and Salt Lake City continue to perform well in net absorption.
An increase in new supply in the southern part of California in markets like San Diego and the Inland Empire may create an opportunity for improved net absorption there. The Midwest has performed well in rent growth recently, but more due to less new supply pressure than to impressive demand. Indianapolis, Cincinnati – Dayton, and Milwaukee could continue to be bright spots there.

Average Occupancy Likely to Decline Further
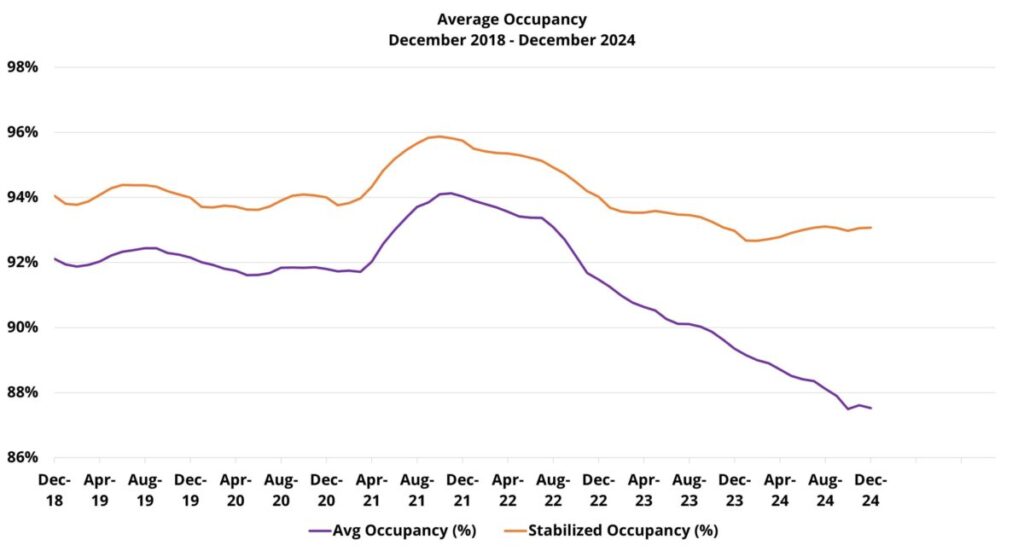
National occupancy change has been straightforward for the last few years. Apartment demand has been unable to keep pace with a glut of new supply. That imbalance has pressured average occupancy down from a peak of nearly 95% in late 2021 to a low of about 88% to end 2024.
The average occupancy for stabilized properties peaked in late 2021 at about 96% and ended 2024 at 93%. However, after two consecutive years with an average occupancy decline, the stabilized average rose by 0.4% in 2024. This was thanks to a resurgence in demand that saw annual net absorption top 60,000 units after stabilized properties suffered a net loss of more than 270,000 leased units in 2022 and 2023 combined.
Even with good reason to expect further improvement in apartment demand in 2025, and with the possibility of a sizable reduction in new supply – net absorption is unlikely to fully close the gap and allow occupancy to begin to recover. The only year within recent memory in which national net absorption topped 450,000 units was 2021. That year had numerous unique tailwinds that allowed apartment demand to reach historic heights.
More likely, the decline in national average occupancy this year will be smaller than in the previous year for a fourth straight year. In 2022, national occupancy fell by 2.7%. Last year, the decrease was by only 2%. 2026 appears to be a more likely target than 2025 for actual average occupancy improvement nationally.

Rent Growth on the Mend
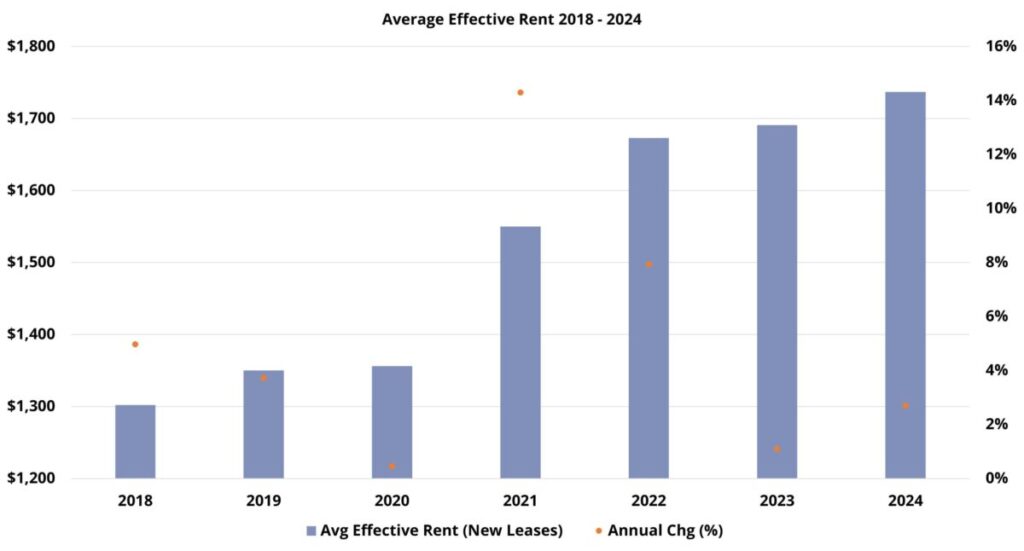
After an anemic 1.1% gain in 2023, the average effective rent for new leases rose by 2.7% in 2024. The year-over-year improvement put an end to a two-year slide in rent growth and nearly returned the industry to the often cited 3% baseline rate of growth.
When considering the likelihood of continued improvement in 2025, factors like interest rates and potentially higher transaction volume will play vital roles. However, there is plenty to be gleaned from industry performance data itself.
Rent growth was most robust in the top two price classes – both for conventional properties overall and for just stabilized properties. With consistently more resilient demand, and a greater share of new supply, this was not a surprise. Further improvement in net absorption, and a reduction in new supply pressure, could allow for higher rent growth in 2025 for these segments as occupancy declines are mitigated.
Added potential for higher rent growth this year comes from the workforce housing segments. The Class C and Class D subsets have broadly been about one year behind the top two price tiers in their demand recovery. In general, rent performance lags demand. The bottom two price classes each saw a substantial improvement in net absorption last year. There is good reason to believe rent performance could respond in kind this year.
Rent growth was also stronger outside of primary markets. Slightly better size-adjusted demand and slightly lower size-adjusted new supply allowed secondary, tertiary, and micro markets to support moderately higher occupancy rates than primary markets. A brightening outlook for many primary markets across the Sunbelt bodes well for rent growth this year. So too does the fact that many smaller markets continue to have much to like in their fundamentals – not least migration trends among prime rental cohorts.

Takeaways
Market conditions have been steadily improving for the multifamily industry for two years now. 2024 was another step in the right direction across the board. The outlook for 2025 appears to be encouraging as well.
New supply, though not certain to be materially lower, is likely to be. Apartment demand has been trending up for two years and should continue to do so this year. Rent growth reemerged in 2024 and indicators for further progress in 2025 are positive. National occupancy may not regain any ground lost over the last three years in 2025, but this year’s decline could be smaller than in any of the last three years.
Of course, risk remains ever present. New supply is expected to decline this year, but there is potential for 2025 to match or even exceed the 2024 total based on construction duration changes. Geopolitical threats have grown more numerous in recent years, and a change in the White House always includes some level of uncertainty.
Even so, 2025 opens with more reason for optimism for the multifamily industry than has been the case in the last few years.
Disclaimer: All content and information within this article is for informational purposes only. ALN Apartment Data makes no representation as to the accuracy or completeness of any information in this or any other article posted on this site or found by following any link on this site. The owner will not be held liable for any losses, injuries, or damages from the display or use of this information. All content and information in this article may be shared provided a link to the article or website is included in the shared content.

