

Demand Improving for Stabilized Properties
Since reaching a peak of 97% in the summer of 2021, average occupancy for stabilized properties steadily declined in 2022 and 2023. A combination of household consolidation and increased competition from a very active multifamily construction pipeline were factors in the prolonged fall. However, through the early portion of 2024, signs of improvement have emerged.
All numbers will refer to conventional properties of at least 50 units. ALN defines stabilized properties as properties that have achieved 85% occupancy at least once or are at least 12 months removed from construction completion.
View the full monthly Markets Stats PDF
Widespread Net Absorption Improvement
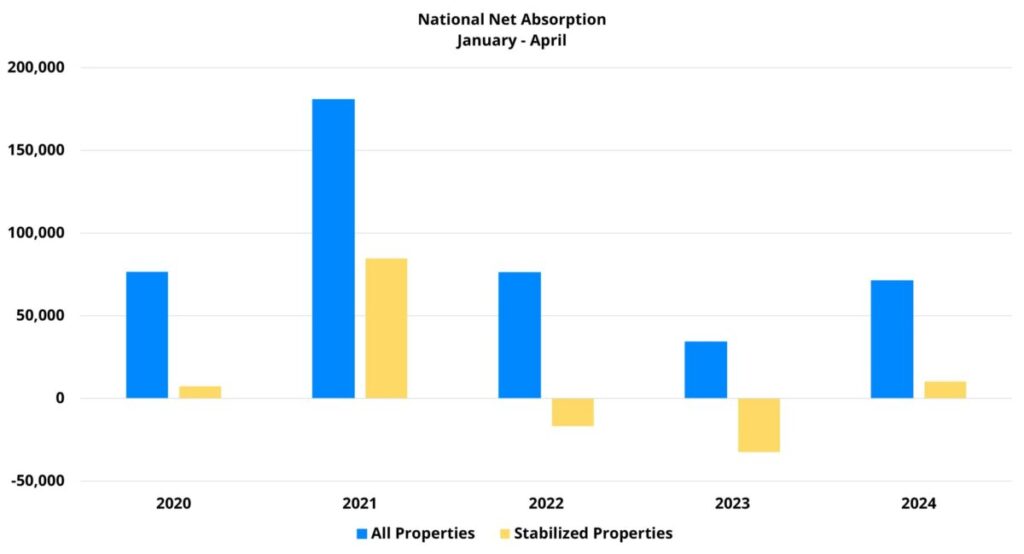
National net absorption for properties that entered 2024 already stabilized totaled just over 10,000 units through the first four months of the year. This level of realized demand was higher than in 2020, 2022, or 2023 for the same portion of the calendar. In fact, in both 2022 and 2023, stabilized properties suffered a net loss of leased units from January through April.
Last year, stabilized properties suffered a net loss of more than 32,000 leased units through April. This year’s positive result therefore represents an improvement in absorption of more than 40,000 units. Further reasons for encouragement appear when digging into the absorption data.
For one, progress has been geographically widespread. Partitioning the national data into the National Apartment Association (NAA) regions shows that all ten regions have surpassed last year’s net absorption total for the period. Eight out of ten bettered the 2022 net absorption total as well. Regions 9 (Louisiana, Mississippi, Alabama, Florida) and 10 (California) showed particular year-over-year improvement. For the Gulf states, Florida accounted for the vast majority of the increased absorption.
Another point of encouragement was the widespread nature of the recovering demand across price classes. All four price classes in the stabilized space managed to exceed the net absorption from last year in the first four months of 2024. For Class B and Class C, this year’s net absorption has been the highest of the last five years with the exception of 2021. Stabilized Class D properties improved year-over-year, but still suffered a net loss of more than 5,700 leased units in the period.
While it is true that 2024 has brought with it a notable turnaround in demand for properties that entered the year stabilized, an important caveat remains. This year’s net absorption total through April remained well below the average from 2017 through 2019 of about 49,000 units.
Rent Growth Variance Across Price Classes
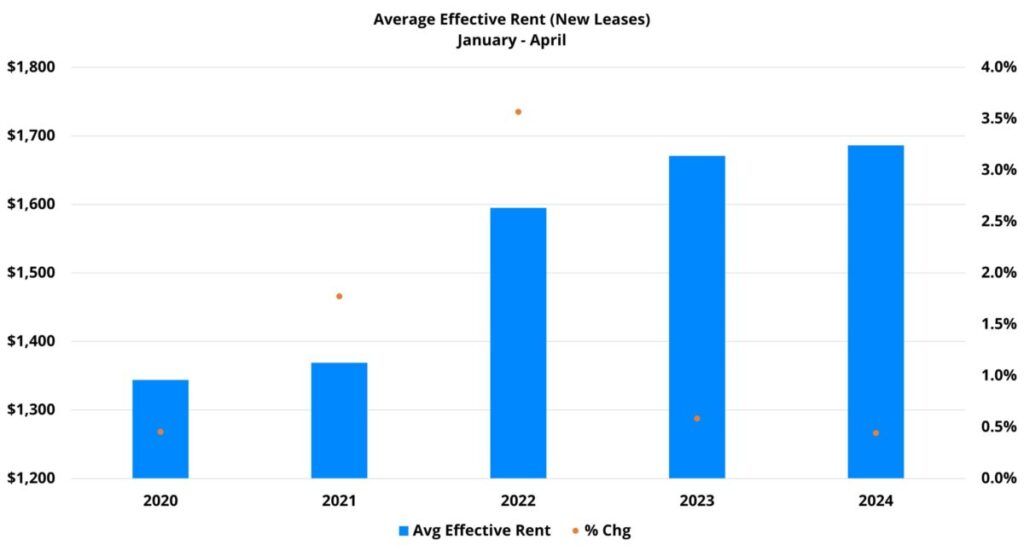
The demand improvement seen so far this year within stabilized properties has come at the expense of rent growth, but only marginally. Average effective rent for new leases rose by 0.4% in the period after an increase of 0.6% in the same portion of 2023. Recent rent growth was a far cry from the 3.6% gain in the first four months of 2022. However, within the current environment for multifamily, positive rent growth paired with considerable demand improvement constitutes a win.
Rent performance has not been quite as uniform as the absorption improvement. For all ten NAA regions, rent performance to start 2024 has been equal to, or better, than in the opening months of 2023. Region 5, which covers the Midwest, led the way with a robust 1.7% average effective rent gain through April. But the story was not as straightforward for price class.
Both of the top two price tiers have gained approximately 1% in average effective rent so far this year. For Class C, a 0.5% gain was just less than last year’s 0.7% increase in the period. The Class D subset struggled – a 0.7% decline in the period this year followed a 0.7% average effective rent gain last year.
Layering the absorption data back on, Class B stabilized properties have gotten off to the strongest start to 2024 with robust demand improvement and average effective rent growth of more than 1%. On the other end, Class D properties have suffered a net loss of leased units along with negative rent growth.
Takeaways
The start to 2024 has been promising for stabilized properties. Apartment demand remains well below the pre-COVID period, but substantial improvement has materialized relative to 2022 and 2023. Not only has demand increased, but rather than just being the result of concentrated improvement in one region or in one price class, progress has been made across the board.
The picture is not quite so neat with rent performance. Rent growth has met or exceeded last year’s in the period for all ten NAA regions nationally, but notable differences emerged among the price classes. The top of the market has managed to gain ground with both net absorption and rent growth, while the Class C and Class D subsets have seen demand improvement come at the expense of rent growth – especially for Class D.
With the new construction pipeline set to continue delivering units apace, and with a labor market that appears to be steadily cooling, challenges remain. On the other hand, the stronger part of the calendar for the industry is now in full swing. 2024 will be another interesting year, but stabilized properties have at least gotten off to a reasonably solid start.
Disclaimer: All content and information within this article is for informational purposes only. ALN Apartment Data makes no representation as to the accuracy or completeness of any information in this or any other article posted on this site or found by following any link on this site. The owner will not be held liable for any losses, injuries, or damages from the display or use of this information. All content and information in this article may be shared provided a link to the article or website is included in the shared content.
Feel the Love of Great Data
Going to Philadelphia for the 2024 Apartmentalize June 19-21? Stop by to see ALN in Booth 1806 and find out everything new in our platforms and our data! Want to see how we can help before then? Click the button below and we’ll help discover all the ways our data and research can help your business!
