Concessions Continue Their Retreat
The rate of multifamily rent growth so far in 2021 has been much discussed recently as gains have reached dazzling levels on the back of historic apartment demand. Asking rent increases have contributed mightily to the growth, but the continued retreat of lease concessions has played a major role as well.
As always, numbers will refer to conventional properties of at least 50 units.
Pre-Pandemic Concessions
Back in February of 2020 before the COVID-19 pandemic really began to have a widespread impact on the economy, 16% of conventional properties were offering a lease concession at the national level. Of those offering a discount, the average concession package value was about three weeks off an annual lease.
View the full monthly Markets Stats PDF
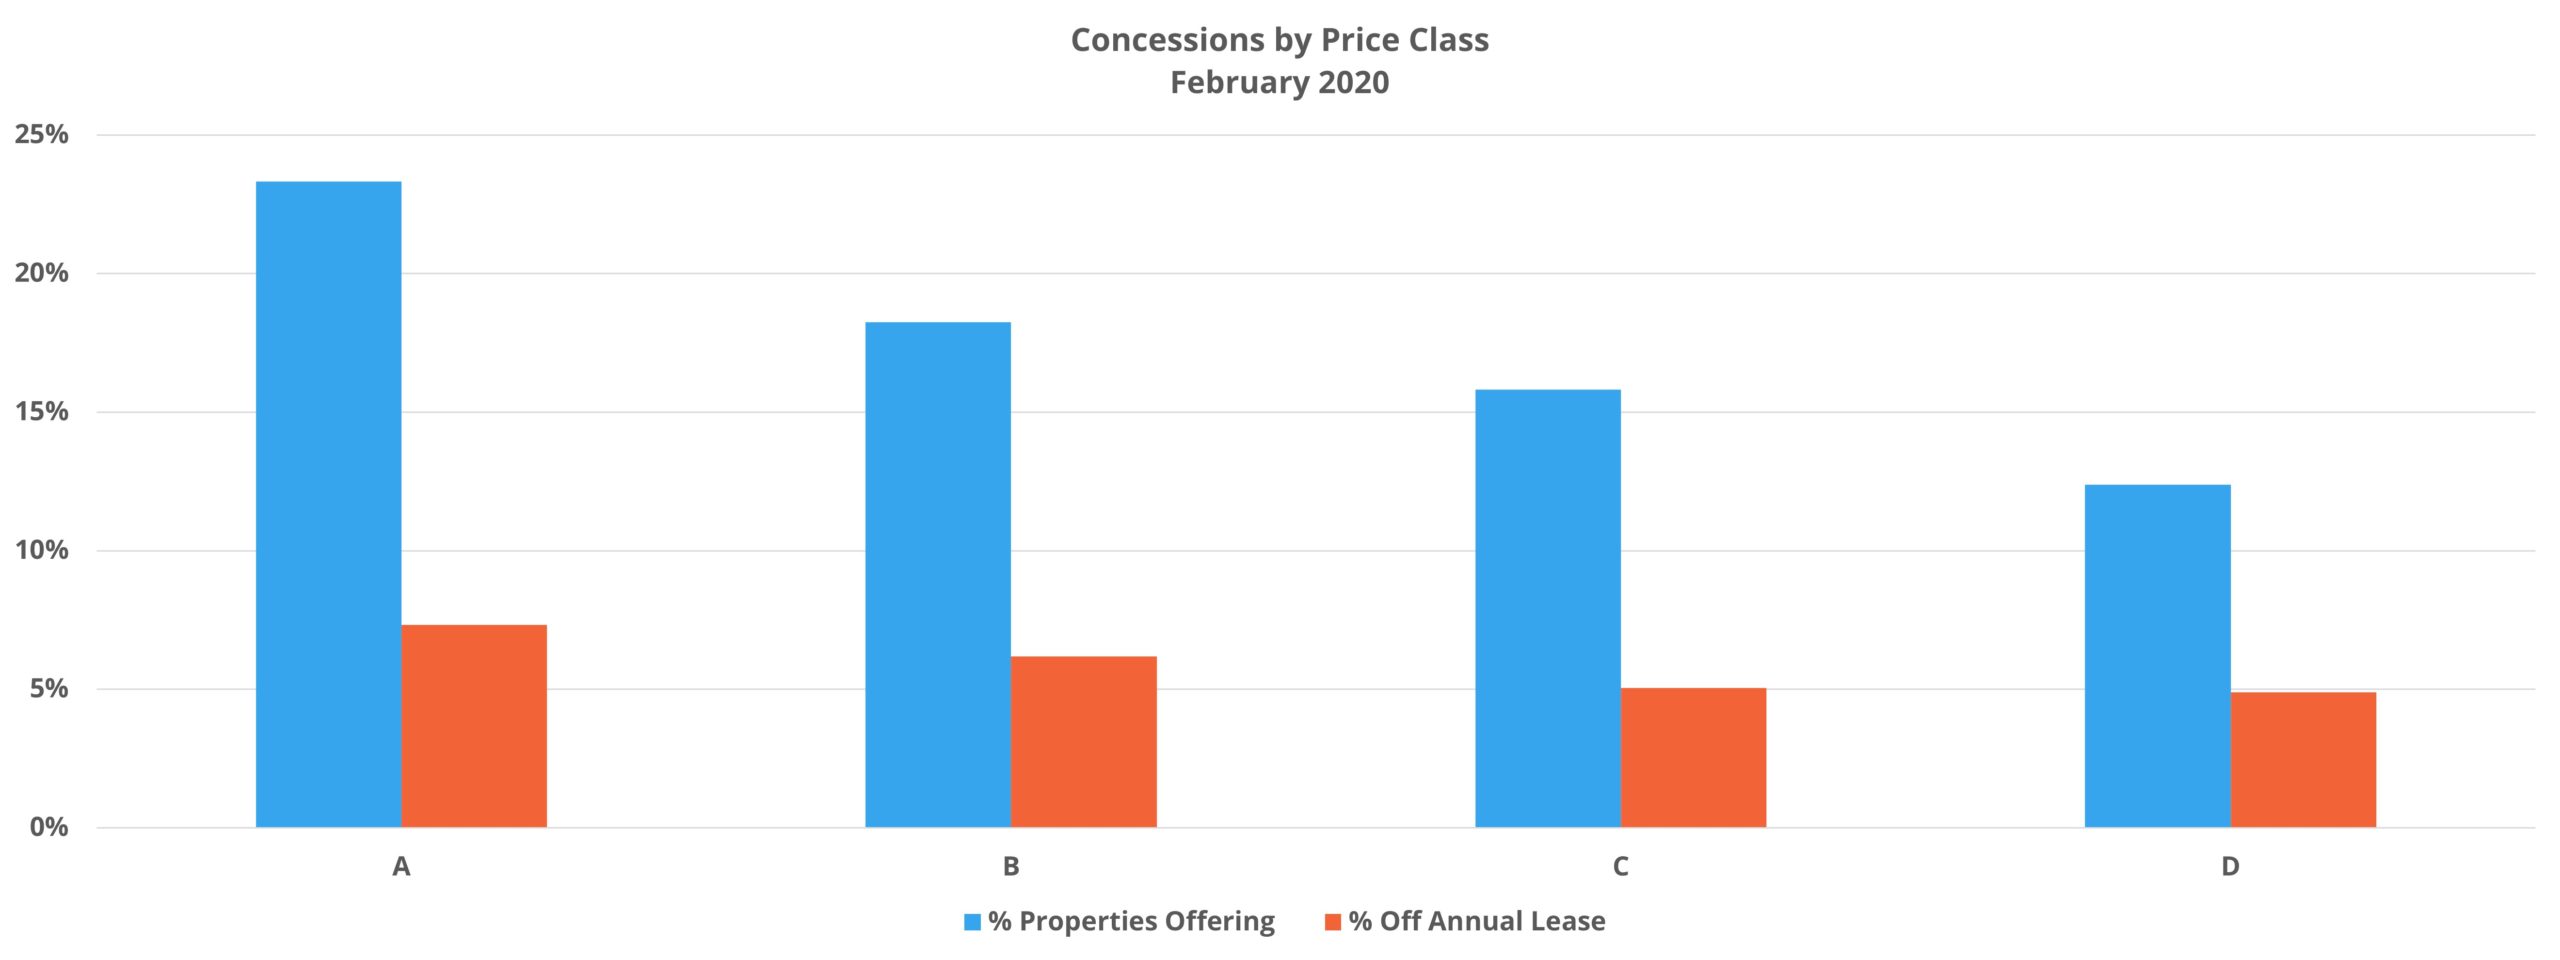
At that time, there was not much difference in either concession metric between primary, secondary, and tertiary markets – though secondary markets at 14% availability had the lowest proportion. There was more variance between the price classes. Unsurprisingly, Class A led the way both in discount availability and in the size of the average discount package being offered. About one-quarter of Class A properties were offering a lease concession and the average value stood at 3.8 weeks off an annual lease. On the other end of the spectrum, with only 12% of properties offering a discount and with an average discount value of 2.5 weeks off an annual lease, concessions played the smallest role within Class D properties.

In February of 2020, only seven markets around the country had at least one-third of conventional properties offering a concession – Fargo, ND and six Texas markets. Houston was the only primary market on the list, and it was joined by other southern Texas markets with a heavy reliance on the energy sector like Victoria and Corpus Christi. In terms of the average concession package value, specific markets that stood out from the pack were predominately in Florida. Areas such as Miami, Fort Lauderdale, and Melbourne were averaging four weeks off an annual lease compared to the national average of three weeks.
Pandemic Peak
Nationally, concession availability peaked in December of 2020 with 20% of conventional properties offering a discount after steady monthly increases dating back to the start of the pandemic. The largest monthly increases came in April, May, and June when discount availability nationally rose by between 3% and 4% each month. The average discount value peaked later, in March of 2021, at four weeks off an annual lease. However, the average value was very nearly at the level as far back as November of 2020 without much movement between November and March.
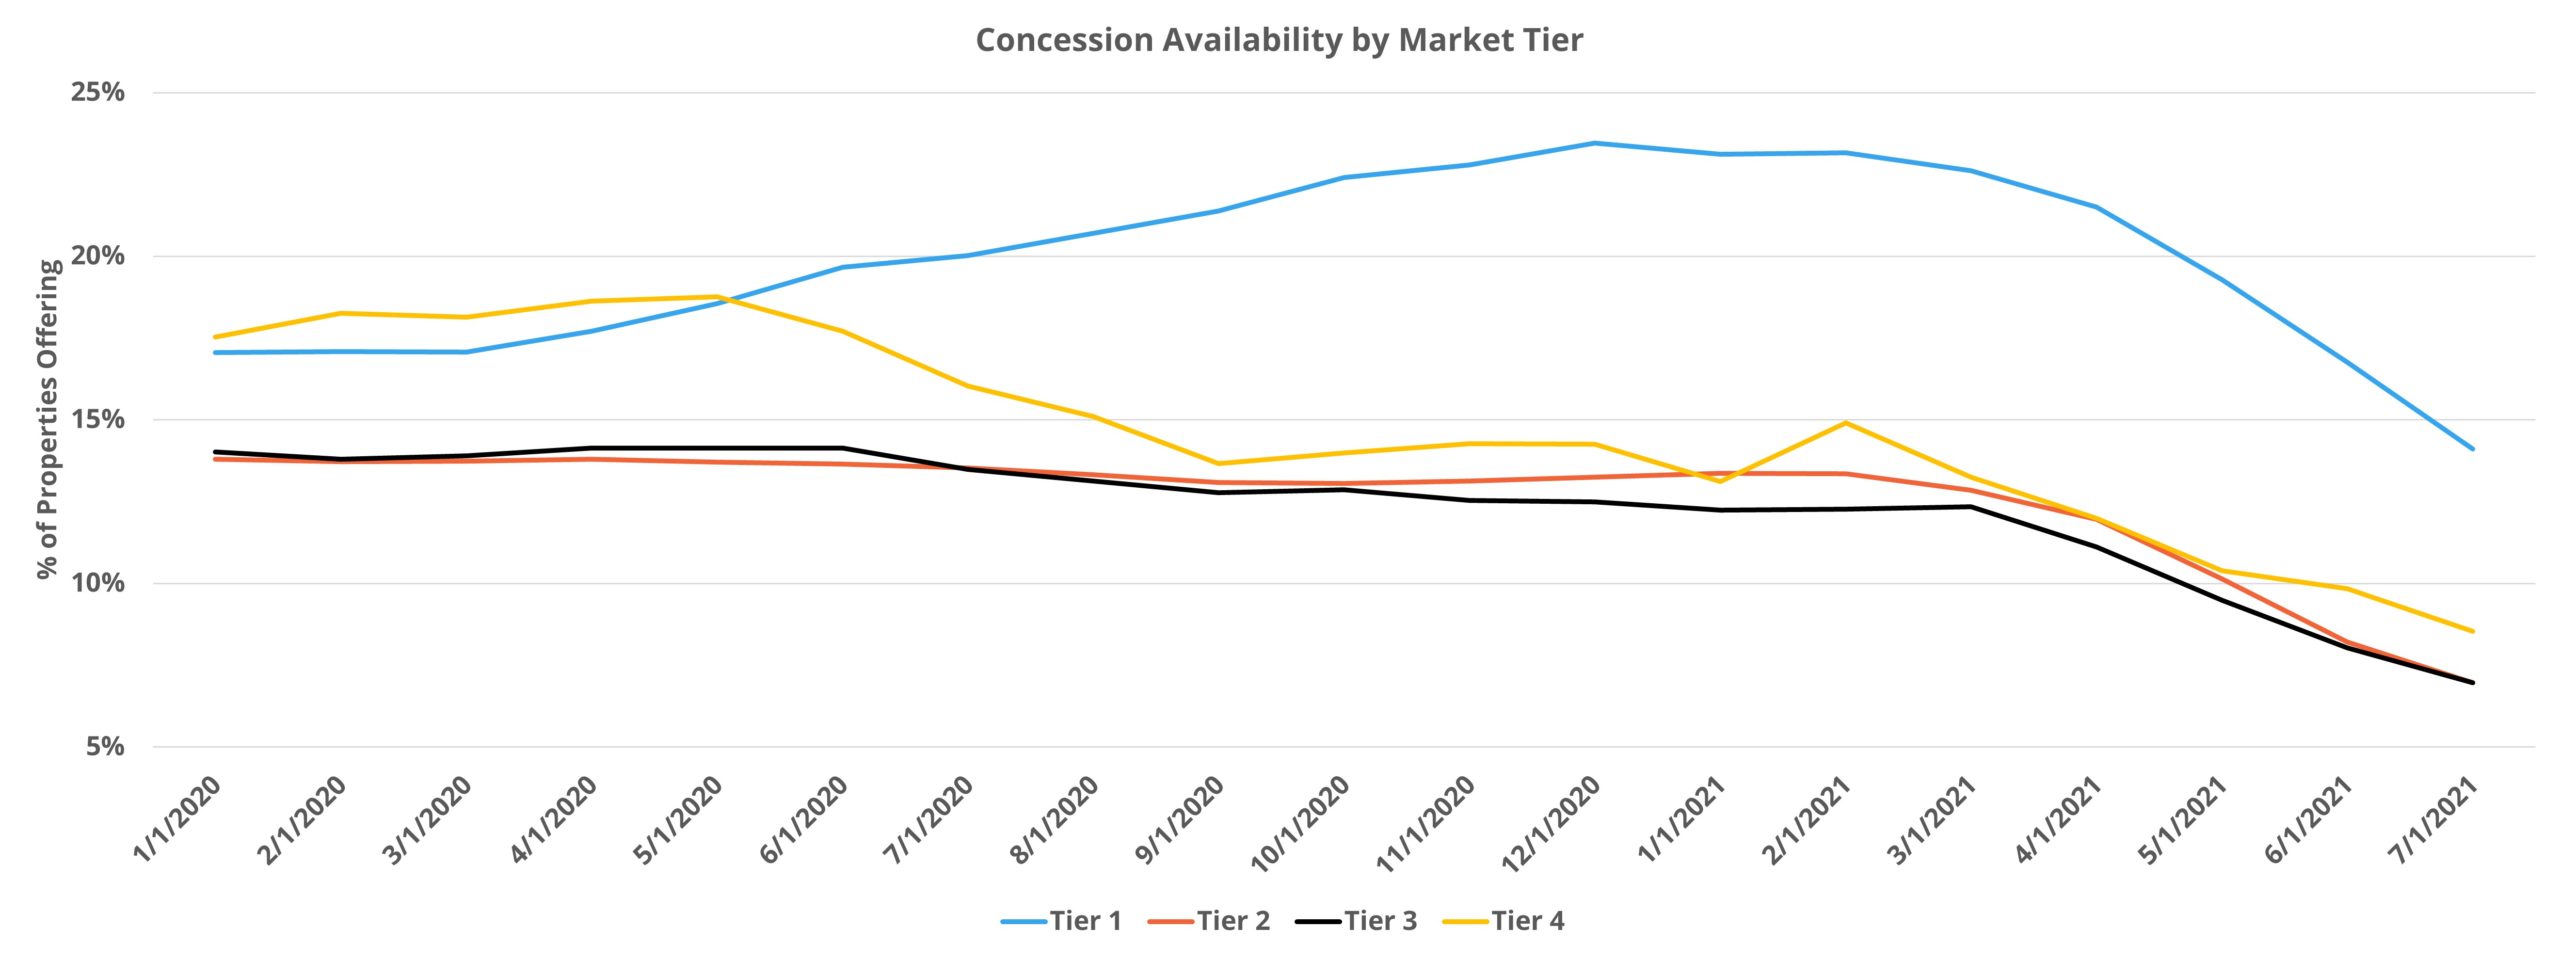
One of the most striking developments of 2020 relative to concessions was that it was really only in the largest markets that availability or average value materially increased. In fact, remove the 33 largest multifamily markets, what ALN refers to as Tier One markets, and both concession availability and the average discount value were lower at mid-year last year than at the start of the year. In those largest markets, 17% availability in February had grown to 24% by December and the average discount had moved from three weeks off an annual lease to nearly 4.5 weeks off.

A similar dynamic played out across the price classes. Although neither of the two concessions metrics decreased during the height of the pandemic in the lower price tiers, they essentially remained flat for Class D and rose only slightly for Class C. For Class B properties, both availability and average package value increased, but not to the extent seen in the Class A space. 23% of Class A properties were offering a discount in February of 2020 and by the time availability peaked in December, that figure was up to 35%. In that time, the average package value moved from 3.8 weeks to 5.5 weeks off a 12-month lease.
Multifamily Recovery
It was not until the end of May 2021 that the rate of concession availability dropped substantially at the national level, with about 16% of properties offering a discount. While the average discount value ticked down in April by about 1.5%, the more significant decrease of 3% also occurred in May. In June and July, the average discount further retreated by 4% in each month while availability dropped by about 15% in each. As of the end of July, concession availability was at 12% of properties offering – lower than in the months preceding the onset of the pandemic. The average discount value remained slightly elevated at 3.7 weeks off an annual lease.
Differences certainly remain below the national numbers. For markets outside of Tier One, concession availability to end July was considerably less than not only in July of 2020, but in July of 2019 as well. For those largest markets, availability of 14% in July of 2021 was basically even with that from July of 2019. Even so, the average discount value remained higher for markets across the four market tiers in July than their pre-pandemic levels.

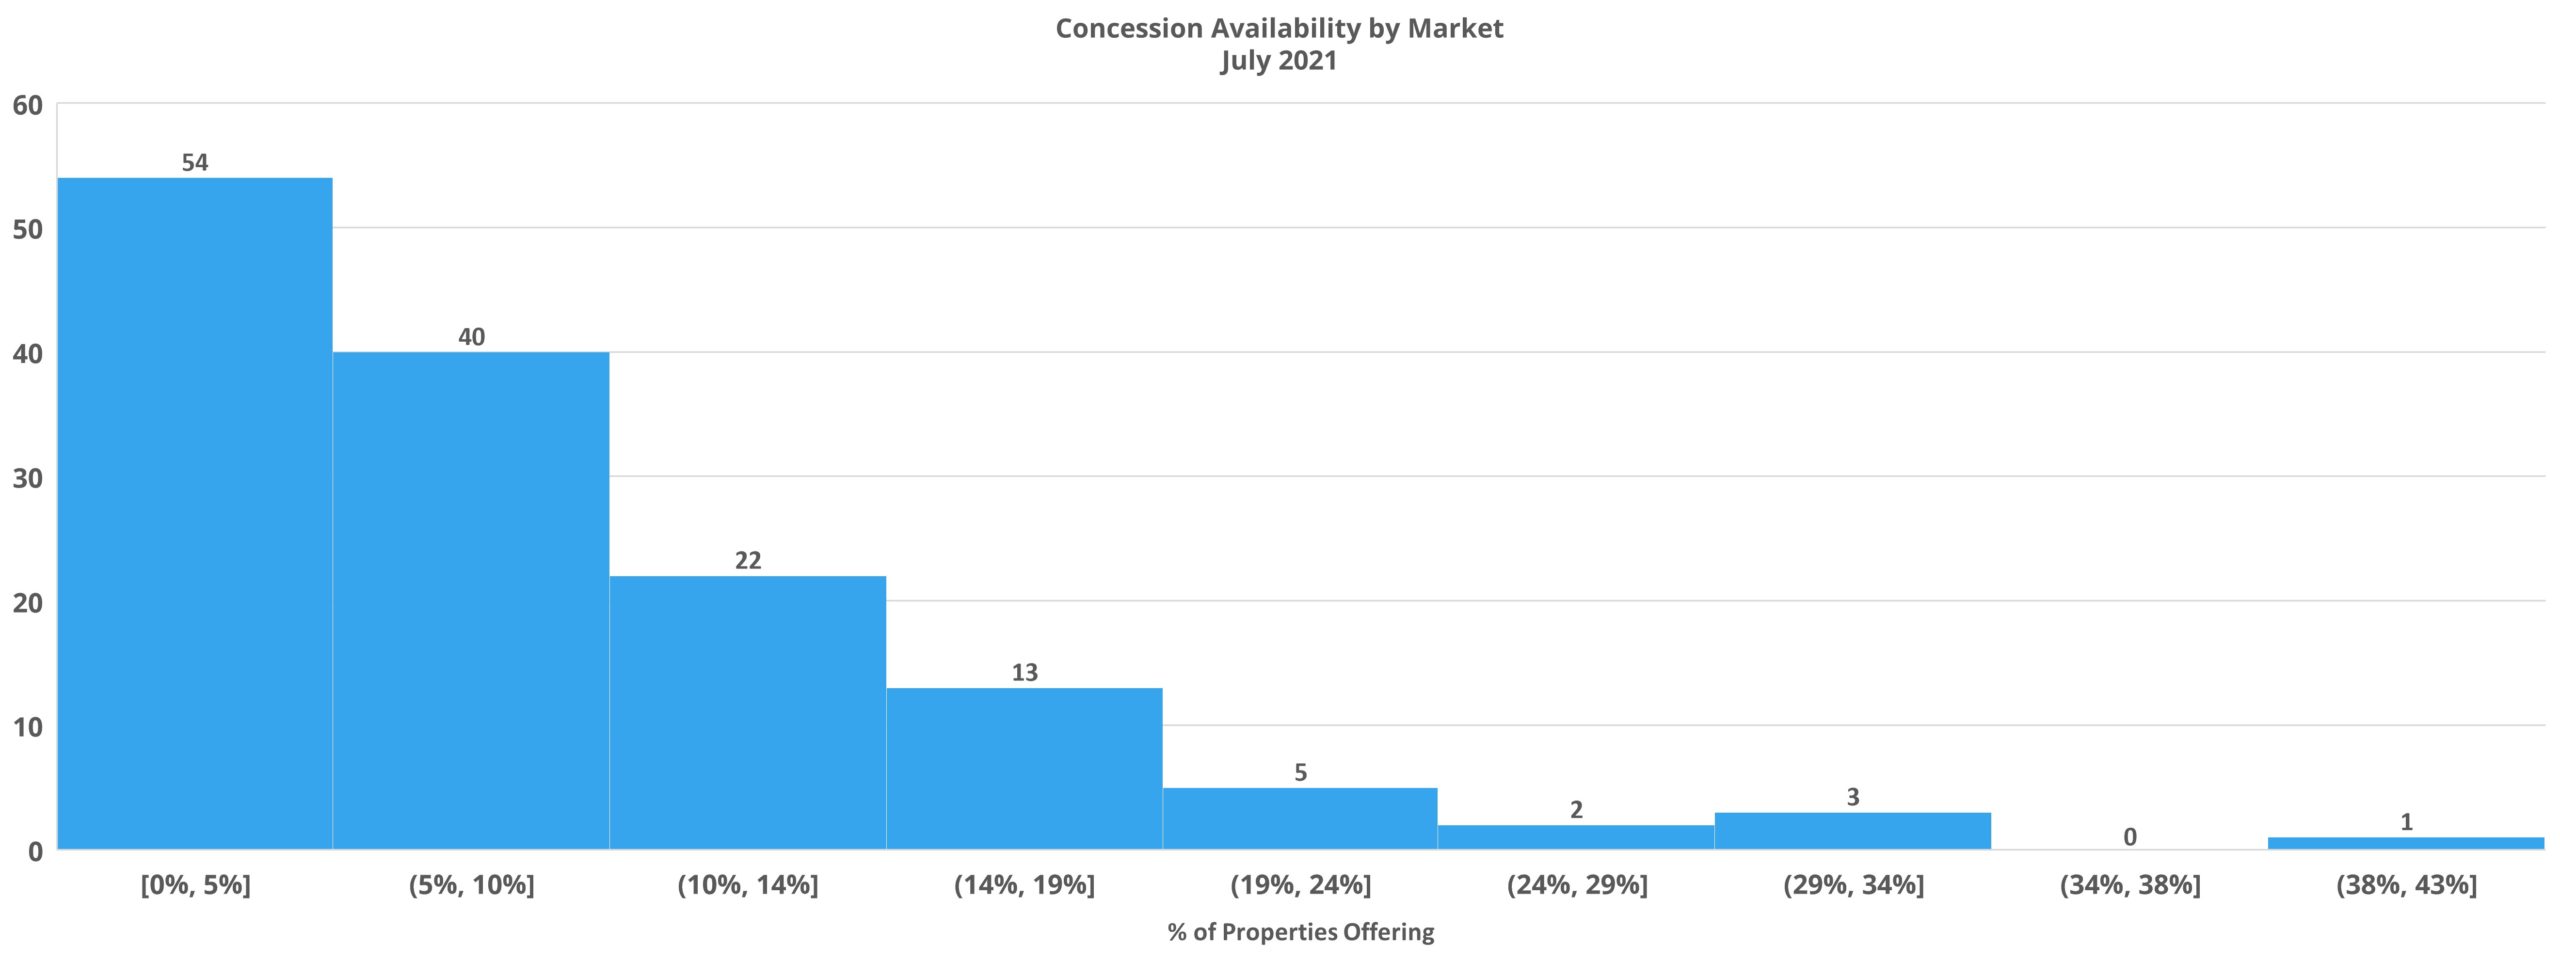
While markets across the southern region of Texas currently remain near the top of the list for discount availability, Midland – Odessa was the only area in the country that had one-third of its conventional properties offering a discount in February 2020. Similarly, 36 markets had at least 20% of properties offering a discount in February 2020, and that number in July of 2021 was down to nine. One area is in a category of its own in terms of average discount value. New York City closed July with the average concession package value at almost six weeks off an annual lease.
Takeaways
Unprecedented apartment demand during the current multifamily recovery has led to rent growth not seen in decades. One part of that story has been the movement in lease concessions, both in availability and average value, after operators pulled the discount lever last year. After a peak in December of 2020 nationally, availability is now below that from the months leading into the pandemic. The average discount value remains somewhat higher, but that metric peaked later, in March of 2021, and is on a downward trajectory. A shallower draw down in average concession values among properties offering a discount compared to the retreat in availability also likely indicates concessions are now being used as a tool for properties continuing to struggle rather than as a broad-based response to the COVID-19 disruption.
The best data for your budgets

Disclaimer: All content and information within this article is for informational purposes only. ALN Apartment Data makes no representation as to the accuracy or completeness of any information in this or any other article posted on this site or found by following any link on this site. The owner will not be held liable for any losses, injuries, or damages from the display or use of this information. All content and information in this article may be shared provided a link to the article or website is included in the shared content.

