Price Class Performance Nationwide
One of the ways to evaluate multifamily performance is to look at the usual metrics through the lens of price class rather than just by geography. This month let’s consider the year-over-year nationwide performance of the ALN price classes for conventional properties—a period from October 2018 through October 2019.
ALN does not assign a typical property class because that classification is subjective and can change market-to-market. Every professional in the industry could have a slightly different definition or perception of what a Class A or a Class C property is, depending on any number of factors. As a result, ALN assigns conventional properties to a price class depending on each property’s average effective rent per square foot percentile rank within its market. This allows for a clearer apples-to-apples comparison of market segments around the country.
View the full monthly Markets Stats PDF
The Nation
Nationally, the multifamily industry continues to perform well. Construction delays, partially due to a tight labor market, have contributed to a slight pause in deliveries over the last 12 months as completion times elongate. Still, while not matching the 300,000 new units delivered from October 2017 to October 2018, the 283,000 new units in the last year are nothing to sneeze at.
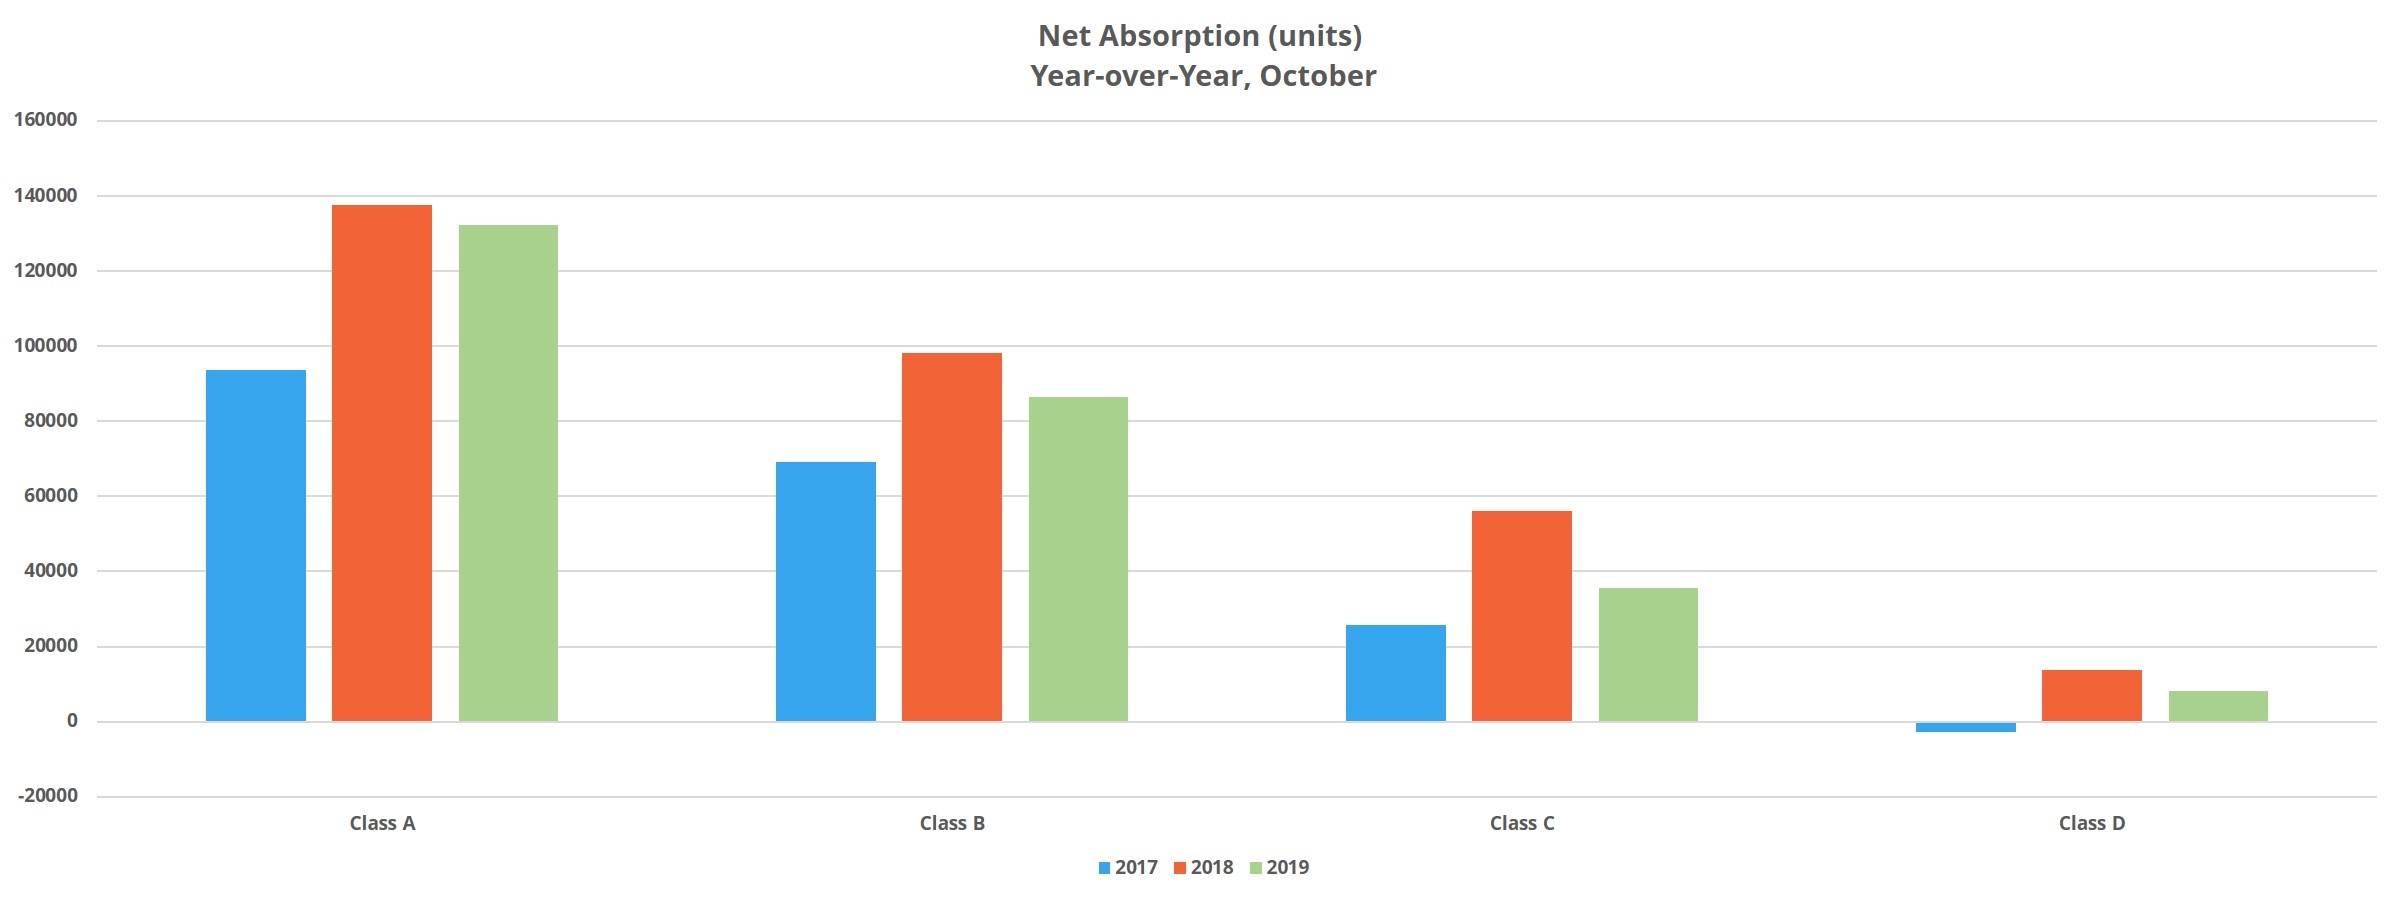
More than 800,000 new units have been brought online in the last 36 months, and in that time, national average occupancy has only moved from 92.4% to 92.3%. This occupancy stability is thanks to the strong demand that continues to permeate the industry. Despite falling short of the 325,000 absorbed* units from October 2017 to October 2018, demand in the last year was robust – to the tune of about 290,000 newly rented units.
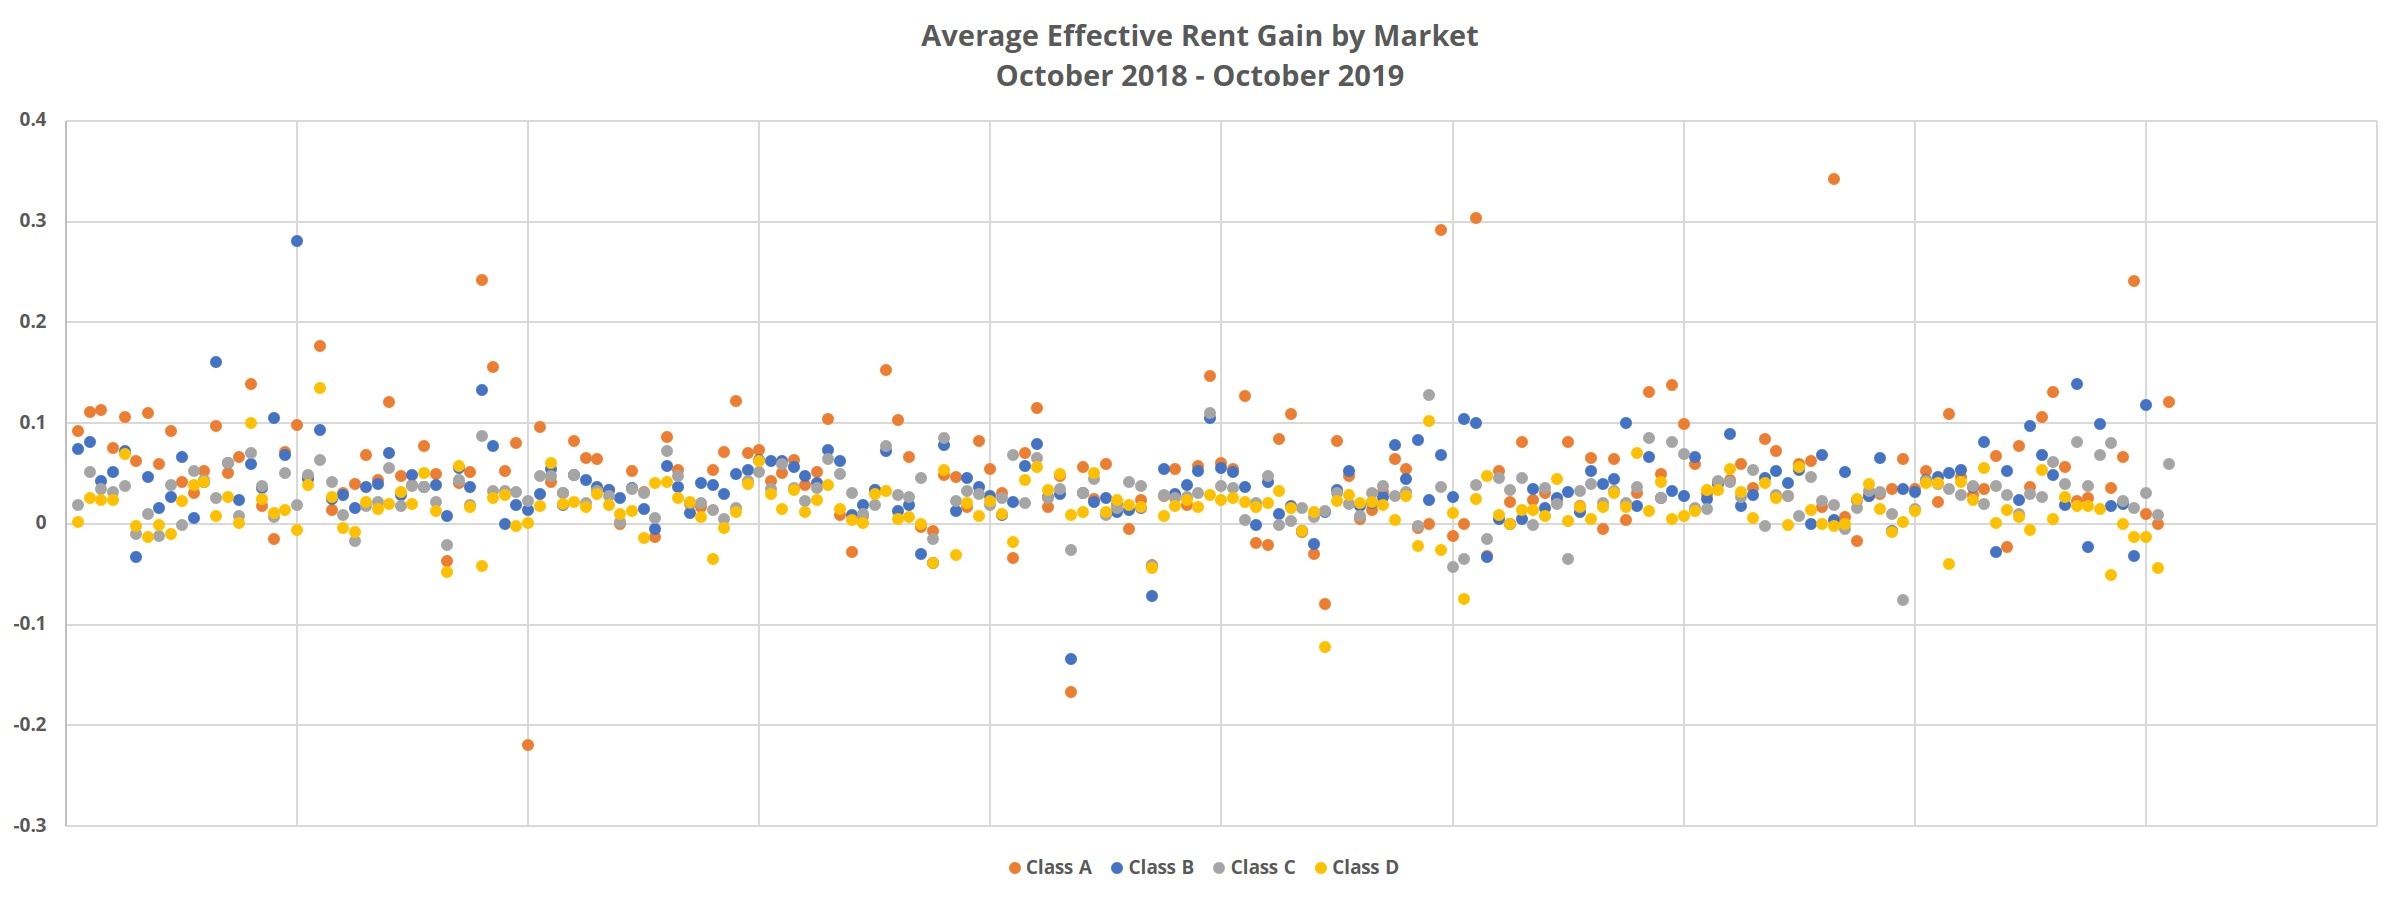
Rent growth is the main difference from just a few years ago. There has been a slow and steady trend downward in rent growth, and the last year has been a continuation of that trend. The last three 12-month periods have seen average effective rent gains of 7.7%, 5% and 3.9% respectively.

Price Class A
Price Class A properties have absorbed a little more than 130,00 units in the last year. That is down slightly from the previous period but is nevertheless a strong showing for demand at the top of the market. That absorption, when combined with 129,000 new units delivered, resulted in an average occupancy gain of 175 basis points during the period to finish October at 87%.
Average effective rent growth for the top price tier was in-line with the national average, coming in at 3.8% to finish at just under $2,000 per unit. The availability of rent discounts has remained stable during these last 12 months, hovering around 19% of properties offering some type of concession. The average value of the discount package has reduced slightly and now stands at just below 7%. Stated another way, the average rent concession is 3.5 weeks off a 12-month lease.
Price Class B
Demand in Price Class B was much like in the top price tier in that it was slightly less over the last 12 months than in the previous annual period. That’s still substantially higher than the twelve months from October 2017 to October 2018. More than 86,000 units were newly rented in the last year in the second price tier, while about an equal number of units were pushed from Class A into Class B by new units at the top of the market. The result was an average occupancy gain of about 25 basis points to end October at 92%.
Rent growth in this tier generally tracks lower than Class A, but the gap has narrowed recently. Average effective rent rose by about 3.6% in the period, to end at about $1,550 per unit. The 3.6% gain is only 20 basis points lower than the Class A annual rate of appreciation. As of the end of October, about 15% of Class B properties were offering a rent discount. The average value of the discount was approximately 6%, or three weeks off a 12-month lease.

Price Classes C and D
The lower price classes have not fared as well when it comes to occupancies. As the new construction pipeline adds new units to the top tier, existing properties are pushed down. Due to reduced demand in Classes C and D, the units pushed into these tiers have outpaced to absorption.
Class C absorbed just under 36,000 units, but more than 47,000 Class B units were pushed into Class C during the same span. The result was an average occupancy decline of about 30 basis points to just over 93%. In Class D, net absorption was roughly 8,100 units and about 8,000 previously Class C units joined Class D. This led to an average occupancy losing 5 basis points to finish at 94%.
Rent growth was lowest amongst these properties, with a gain of 3% for Class C and a gain of just over 2% for Class D. One headwind for rent growth is the increased availability of concessions. About 14% of conventional Class C properties were offering a discount to end October, and 13% of Class D properties. Both price tiers finished October with the average rent concession being valued at 5%, or about 2.5 weeks off a 12-month lease.
Final Takeaways
While absorption, average occupancy and average effective rent have all come back to earth a bit compared to previous periods in the current cycle, multifamily performance remains strong. The flood of new units at the top of the market has not resulted in massive concession increases or retreating occupancies. Class B demand continues to be strong ad rent growth for those properties is approaching that of Class A. In the lower price tiers, average occupancy has stopped its climb, but occupancies remain near 95%.
We expect more new supply in 2020 than in 2019, and although there are some specific markets showing signs of softening, national fundamentals remain strong.
*Net absorption refers to the net change in the number of rented units
Disclaimer: All content and information within this article is for informational purposes only. ALN Apartment Data, Inc. makes no representation as to the accuracy or completeness of any information in this or any other article posted on this site or found by following any link on this site. The owner will not be held liable for any losses, injuries, or damages from the display or use of this information. All content and information in this article may be shared provided a link to the article or website is included in the shared content.

