

Apartment Demand Faltered in January
Just one month into the new year, there are already interesting developments occurring in multifamily performance. January played out to expectations across a variety of metrics. New supply continued to be a major force, with more than 44,000 new units delivered in the month. Average occupancy continued its decline in the face of these new units. Rent growth slightly outperformed January of 2024. The availability of lease concessions grew, but by the smallest margin in three years for January.
One surprise for the month was net absorption. National apartment demand had been on a consistent upward trajectory going back to 2023. January was a step outside that broader trend.
All numbers will refer to conventional properties of at least fifty units.
View the full monthly Markets Stats PDF
National Net Absorption Faltered
A net loss of approximately 38,000 leased units across the country in January was the worst monthly net absorption result in more than five years. Too much should not be made of a single month. However, it is worth digging into what happened in January to gain some insight into any implications for future demand performance this year.
The issue was specific to stabilized properties. Properties that entered 2025 already stabilized suffered a net loss of around 55,000 leased units in January. The positive demand for the month came from lease-up properties. Stabilized net absorption was negative for fourteen consecutive months from early 2022 through early 2023, but no single month in that period experienced a decline of the magnitude seen this January.
Class C properties around the country were the particular pain point. Class C demand finally turned the corner in 2024 after a rough couple of years. Going into 2025, there was some reason to think that positive momentum might carry into the Class D segment. It was only one month, but January Class C net absorption complicated that picture.
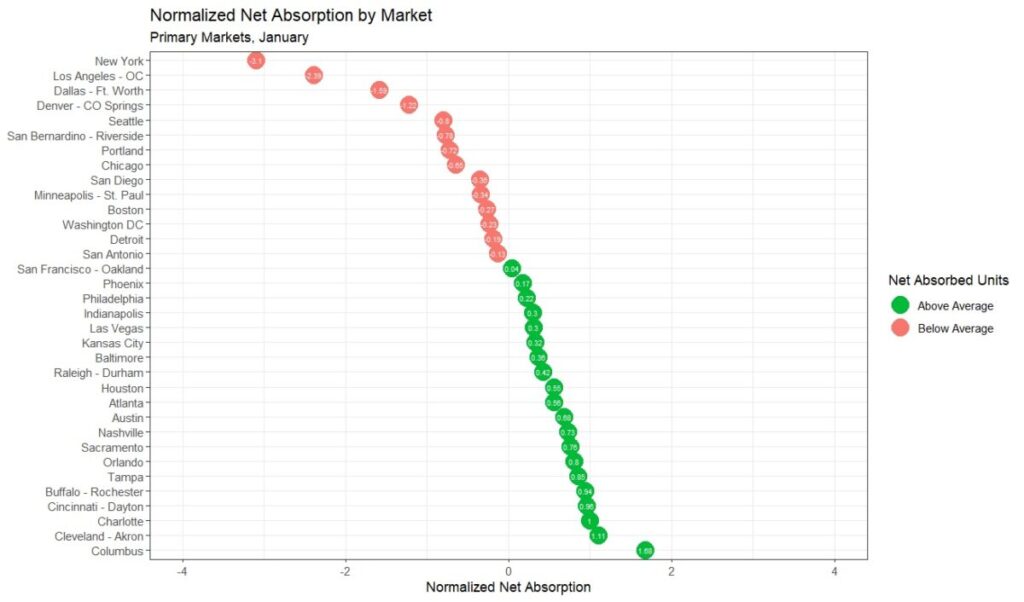
The hardest hit markets for total net absorption in January were New York, Dallas – Fort Worth, Los Angeles – Orange County, Denver – Colorado Springs, and San Bernardino – Riverside. The California markets had historic wildfires to deal with, but the remaining markets cannot lay their struggle at the feet of that exogenous event.
The Winter Had Been Going Well
As already mentioned, too much should not be taken from one month of data. January may end up being an outlier in an otherwise robust year for apartment demand. To add some context, it is helpful to zoom out a little bit.
The fourth quarter of 2024 ended on a high note for apartment demand. More than 55,000 net absorbed units came after the two previous years each saw a net loss of leased units in the final quarter. Demand was also higher than in the same portion of 2018 and 2019.
The poor January showing certainly took a bite out of the national net absorption of the last four months, but nearly 17,000 net absorbed units from October through January was still slightly higher than in the same portion of the calendar a year ago. This was the third consecutive year of improvement for that period.
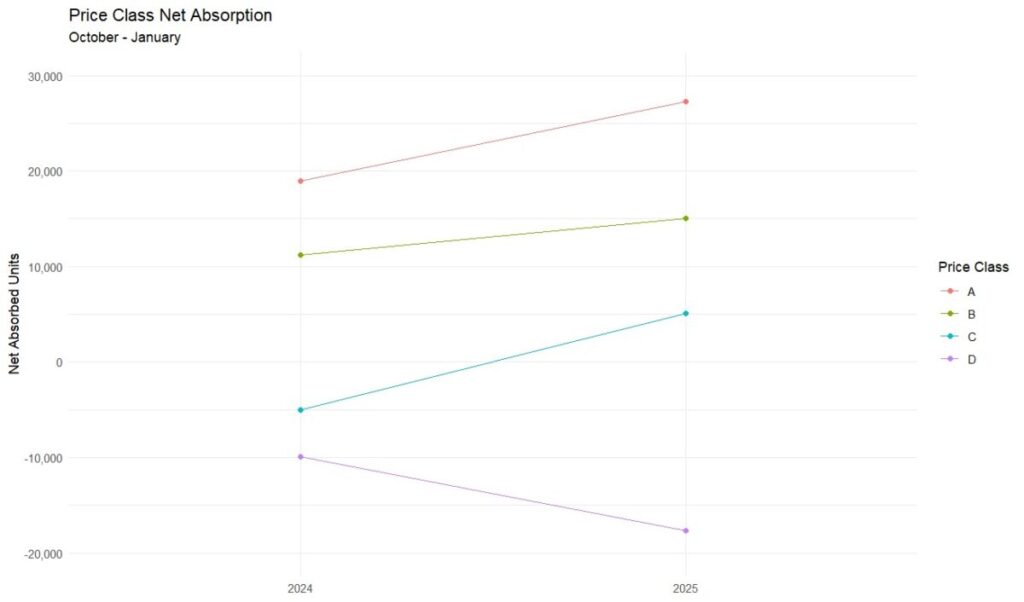
The Class D price class was the only price class to see net absorption over the last four months underperform the same period a year ago. Class C stumbled in January, but Class D has been struggling all winter. A net loss of more than 17,000 leased units since the start of October nearly doubled the decline from a year ago and made this the third straight winter with negative net absorption.
Class D demand had been the final piece of the puzzle to return multifamily to pre-pandemic demand. Class A and Class B demand began to rebound in 2023, Class C did the same in 2024, and there were indications Class D could join in 2025. The new year is young, but the negative trend for Class D has so far remained in place along with a red flag result for Class C.
Takeaways
The opening month of 2025 largely aligned with expectations across the new supply, occupancy, and rent growth metrics. However, apartment demand faltered to a degree that was surprising.
One reason a significant January stumble was unexpected was the strong multifamily demand in the final months of last year. That momentum, at least for one month, did not carry into the new year. The month-over-month change in national net absorption from December to January was one of the largest in recent years.
Of course, the difficulty was not spread evenly across the industry. While two-thirds of the more than 140 ALN markets across the country suffered a net loss of leased units in January, ten markets accounted for just more than half of the lost units.
Similarly, while all four price classes took a step back last month, the Class C and Class D segments were more concerning. If 2025 were to play out with solid demand at the top of the market but weak or non-existent demand in the bottom two price tiers – this year would more closely resemble 2023 than previously expected.
However, the sky is not falling after one month of poor net absorption. The monthly data has been especially volatile this winter compared to previous winter periods. The negative move in January was surprising in its scale but the picture may look very different this spring. Coming into the year, there was plenty of reason for cautious optimism for 2025 despite it being another high-supply year. One rocky month does not change that calculus, but it is worthy of attention.
Disclaimer: All content and information within this article is for informational purposes only. ALN Apartment Data makes no representation as to the accuracy or completeness of any information in this or any other article posted on this site or found by following any link on this site. The owner will not be held liable for any losses, injuries, or damages from the display or use of this information. All content and information in this article may be shared provided a link to the article or website is included in the shared content.