

A Comparative Look at New Supply
A primary aspect of multifamily industry performance both last year and this year has been the effect of the new construction pipeline. This effect has been exacerbated by the consistently tepid apartment demand that has characterized this period. The current construction boom is most pronounced across the Sunbelt region but is not unique to the Sunbelt. Similarly, although usual suspects like Dallas – Fort Worth, Houston, and New York remain atop the list of market-level deliveries this year, elevated new construction activity is not just a feature of primary markets.
View the full monthly Markets Stats PDF
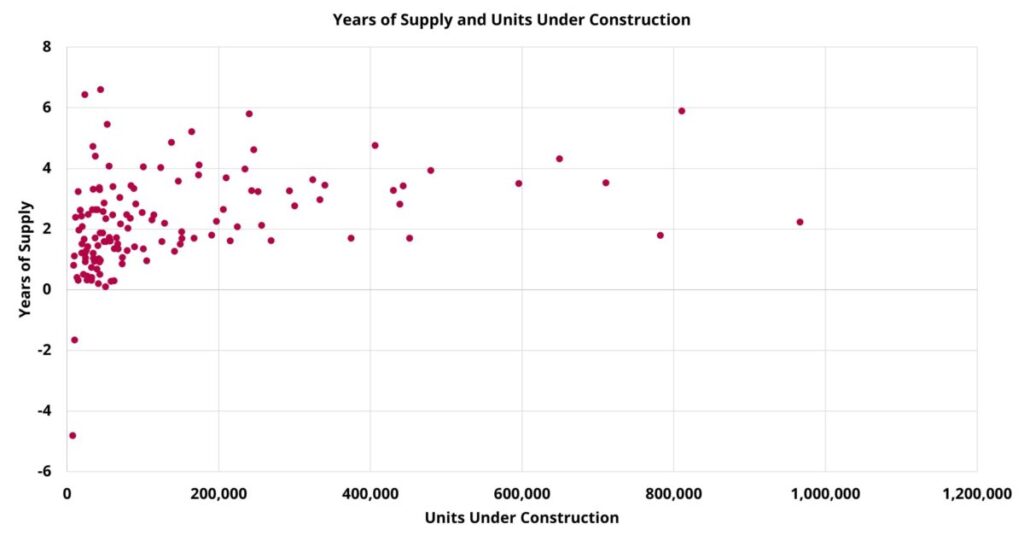
To provide some context around upcoming multifamily deliveries before an expected slowdown in new supply in 2025 or 2026, we will compare new construction numbers to recent yearly demand. Specifically, the focus of this month’s newsletter will be a look at the portion of the market pipeline that is currently under construction relative to that market’s five-year average net absorption figure.
Just the portion of the new construction pipeline that is currently under construction but not yet leasing will be included. This is because these are the properties that have not yet begun to affect their markets but will do so over the coming eighteen months. Also, because of the volatility and unusual aspects of the last few years, a five-year period will be used to determine each market’s average annual net absorption total in order to include some pre-pandemic data.
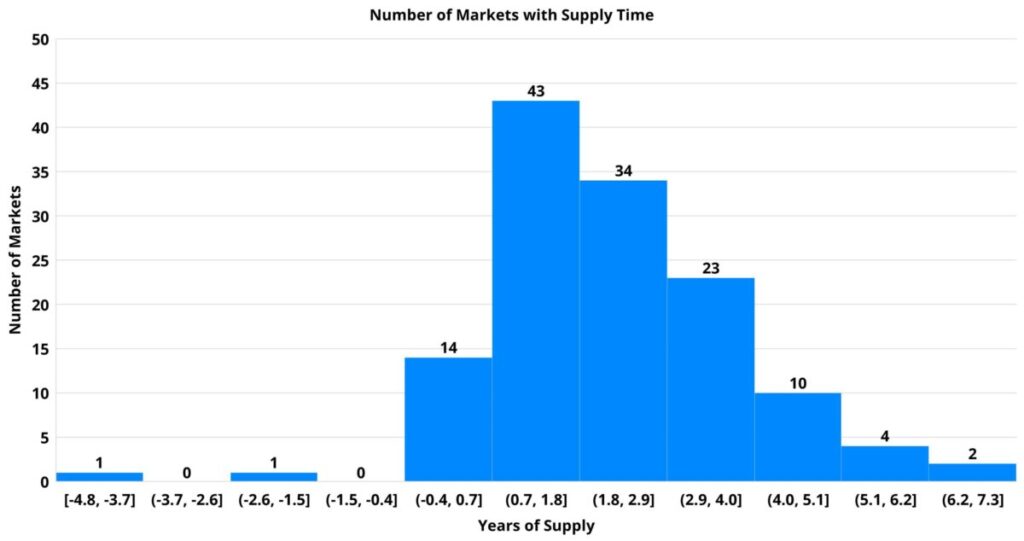
One important note to begin with is that a market could have a high value for this calculated metric to be referred to as years’ worth of supply relative to demand due to a large number of units under construction, a low average annual net absorption, or a combination of the two.

In our series Takeaways, ALN Apartment Data Senior Market Analyst, Jordan Brooks, shares more insight into the final thoughts on the April 2024 newsletter article…
High Supply and Low Demand
The most concerning scenario for near-term industry performance would obviously be a high-supply, low-demand scenario. The good news is that markets with this sort of imbalance are hard to find. Among those areas with the most years’ worth of supply represented by the current portion of the pipeline that is under construction, the closest example might be New York.
A little more than 80,000 units under construction there represent about 10% of existing multifamily stock compared to the national market average of about 5%. The average annual net absorption for the market calculated over the last five years has been roughly 13,600 units. Those units equal 1.7% of existing stock compared to a national market-level average of 1.9%. In this case, the upcoming new supply is well above average while demand has been slightly below average once adjusted for market size. The result is an estimated 5.9 years’ worth of supply currently under construction.
A market with a very similar profile using the size-adjusted metrics of units under construction and average annual net absorbed units as a share of existing market stock is Huntsville. There, about 5,100 units under construction is also equal to around 10% of its pre-existing stock. Average annual net absorption of around 925 units totals 1.8% of market capacity. The interplay between these two variables returns a value of 5.5 years’ worth of supply currently under construction.
A couple of other markets that bear mentioning would be Lincoln and Tallahassee. Each have right around 4.5 years’ worth of supply currently under construction based on slightly lower size-adjusted average demand than the aforementioned markets.
High Supply and High Demand
Two markets stand out in terms of having a glut of new units under construction relative to their size. Fortunately, both are also above average on the demand side of the equation as well.
In Boise, approximately 12,000 units under construction account for 27% of existing stock – the highest mark in the country. Average annual net absorption of a little more than 1,800 units equals 4.1% of existing market capacity, which is well above the national market average of 1.9%. The result of this relationship is 6.6 years’ worth of supply currently under construction – also number one in the nation.
The other market with a similar profile to Boise is Miami. 35,000 units under construction there account for 21% of existing stock. Average annual net absorption of around 6,700 units matches Boise’s 4.1% of existing stock. The result of slightly lower size-adjusted new supply and equal demand is 5.2 years’ worth of supply currently under construction.
Two other markets in this vein would be Raleigh-Durham and Charlotte. In Raleigh-Durham more than 34,000 units currently under construction represents 14% of existing market capacity. Average annual net absorption of just over 5,900 units corresponds to 2.5% of existing stock. Both metrics are well above average, but much more so on the supply side. The result is 5.8 years’ worth of supply currently under construction.
In Charlotte, just over 39,000 units under construction in Charlotte equals 16% of existing stock – slightly higher than in Raleigh-Durham. Average annual net absorption of roughly 8,500 units, 3.4% of existing stock, is also a bit higher. The end result is 4.6 years’ worth of supply currently under construction.
Takeaways
Much more could be said on the topic, but for the sake of length here a follow-up piece will be added to the ALN blog. It should be remembered that this view is based on approximations and is not set in stone.
The new supply that is currently under construction does provide a solid target that will only move slightly based on construction times. More variance is possible on the net absorption side. Markets will not necessarily perform similarly to their five-year average in the coming year or two based on a myriad of factors. Nevertheless, this comparative look provides a useful snapshot to contextualize the different environments facing areas that could be lumped together as high-supply markets.
One takeaway brought into focus is that the higher demand markets tend to have upcoming new supply significantly more above average than the lower demand markets that also have above-average units under construction. For the high-demand markets, it will therefore be imperative that they maintain not only their relatively robust net absorption but also the population and job growth that have helped to fuel it.
Multifamily Business Solutions
Have a one-on-one conversation with us about the data you need and find out how we can help your business!
Disclaimer: All content and information within this article is for informational purposes only. ALN Apartment Data makes no representation as to the accuracy or completeness of any information in this or any other article posted on this site or found by following any link on this site. The owner will not be held liable for any losses, injuries, or damages from the display or use of this information. All content and information in this article may be shared provided a link to the article or website is included in the shared content.