How Affordable is Rent Really?
The multifamily industry has enjoyed quite a run since coming out of the Great Recession. The volume of new units has been staggering, rents have soared, and occupancies have largely remained high. Over the last couple of years, new construction has continued unabated. However, some softening has begun to appear in some industry performance metrics. Have the new units and the higher rents changed the affordability factor for apartments? If so, where? And to what extent?
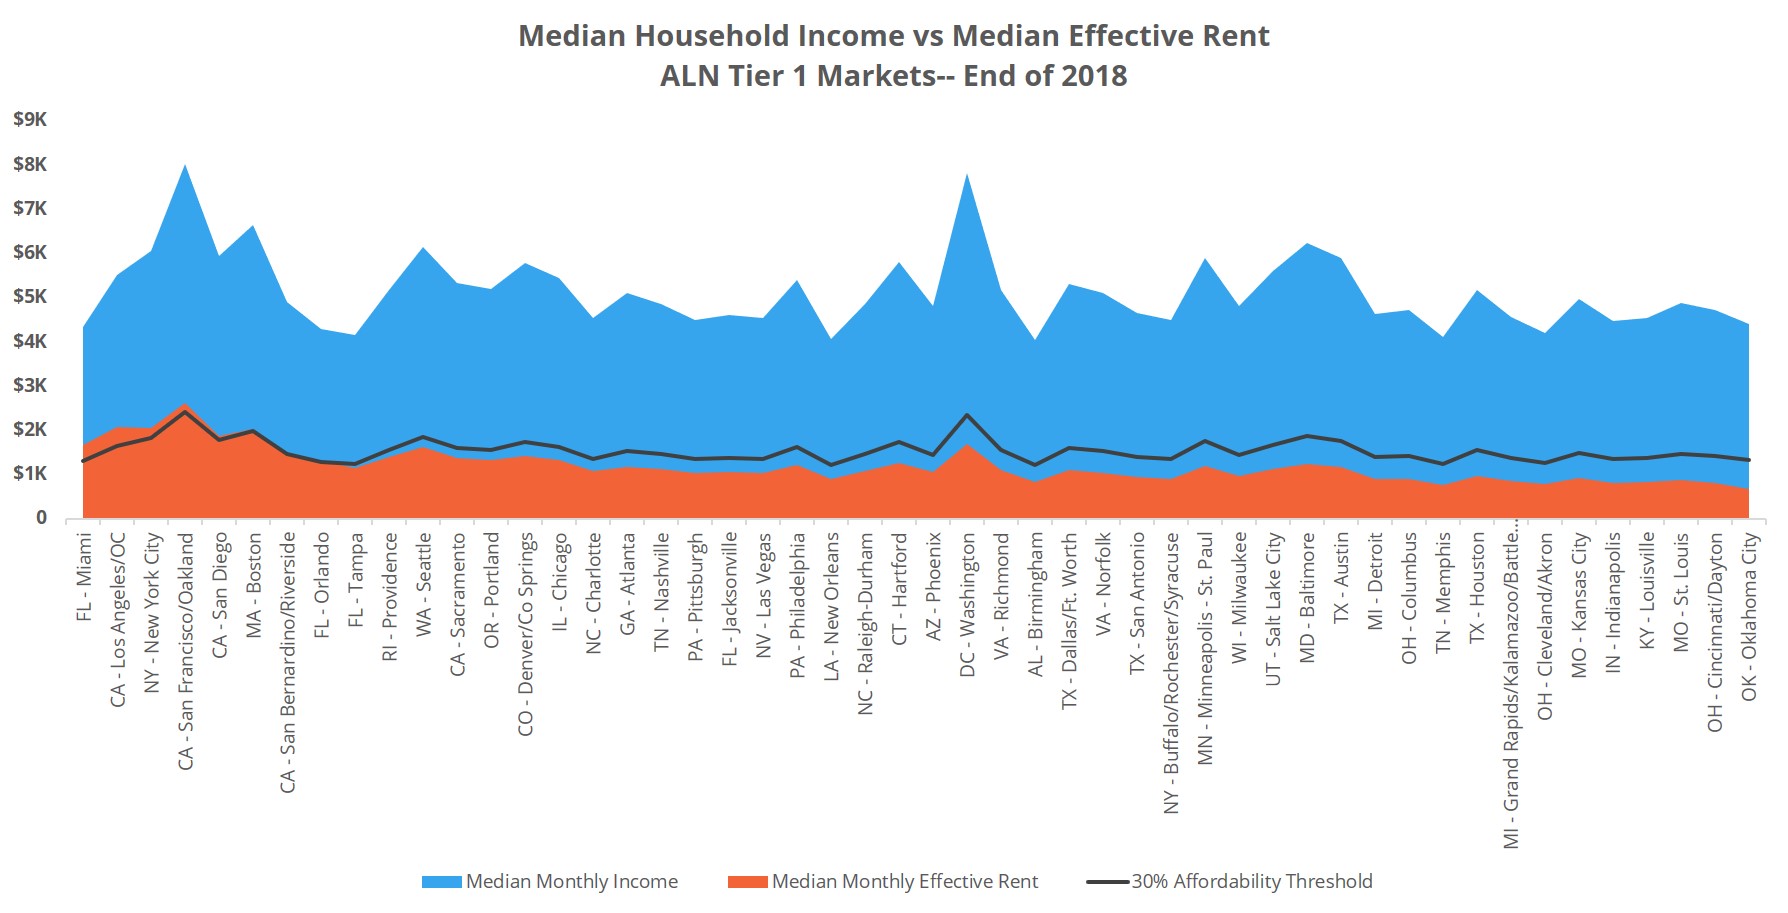
These are questions we’ll explore below. Using ALN market data combined with available government data for metropolitan statistical areas (MSAs), we can get a reliable picture. As a proxy for affordability, we will look at how median household income compares to median effective rent. Household sizes vary, as do floorplan types, but this combination will allow a big-picture view of affordability.
View the full monthly Markets Stats PDF
This analysis will focus on ALN markets that contain an MSA with a total population of at least 1,000,000 people, according to the US Census Bureau. This reduces the pool of markets to 50, referred to as ALN tier 1 markets. Additionally, only conventional multifamily properties will be included. All household income data comes from the most recent American Community Survey (ACS), which was released in 2018 and reflects 2017 data. As a result, 2018 income values are estimated.
Nationwide Affordability Perspective
Before assessing only the ALN tier 1 markets, let’s have a look at the country as a whole. Across the US, more than 750,000 conventional units have been delivered in the past three years. During the same span, median effective rent nationally has risen by about 26%. That rent appreciation pushed the median monthly rent nationally to around $1,220 per unit to end 2018. With the US median household income being just over $62,000, this rent accounts for 24% of monthly income.
Using the typical benchmark of monthly rent being 30% of monthly household income for affordability, a margin remains for renters. However, that margin is shrinking. And it is entirely gone in some areas, and especially for some income brackets.
The Good
Unsurprisingly, all but two of the twenty most affordable markets are situated somewhere between the coasts. Markets such as Oklahoma City, Cincinnati – Dayton, St. Louis, Louisville and Indianapolis round out the top five. To reiterate, these are the markets with the smallest percentage of the median income covering the median rent. In each of these five areas, median monthly rent accounts for less than 20% of the median household income. For reference, the average amongst these 50 ALN tier 1 markets sits at about 23%.
Of course, not every apartment is rented for around the median rent. The affordability picture shifts a bit when we account for price class*. For the top price class, it’s generally understood a significant portion of renters will be those who have the choice of paying a premium for preferred location or amenities. It is no surprise then to find more than half of the tier 1 markets exceed the 30% benchmark.
Some areas do have units at the top of the market that are accessible to a majority of residents. Las Vegas leads the way there, with the median monthly rent for a Class A property taking up about 25% of the median monthly household income. Other markets to just slide in below the 30% threshold include San Antonio, Phoenix, Columbus, and Baltimore.
The Bad
While some areas are trending toward pricing out middle-income renters, others are already there. Markets in coastal states like Miami, Los Angeles, New York, San Francisco, San Diego, San Bernardino – Riverside and Orlando each have rent-to-income ratios above the affordability threshold. Median monthly rent in Miami and LA totals nearly 40% of the median household income.
The two Florida markets also stand out. Many of the most expensive markets also have an accumulation of households in the top income brackets. Some of these households will be the renters that occupy the Class A units. Not only do Miami and Orlando have the lowest median household incomes of this group, but also, households earning $150,000 or more annually make up less than 10% of households. In other expensive markets like New York, San Francisco and Boston, that figure is in the 20-30% range.

The Ugly
Some markets are especially difficult for the average renter. In regions such as Tampa, Orlando, Seattle, San Diego, Chicago and Boston even Class B properties are above the 30% benchmark for the average household. This means that about a third of conventional properties in these markets are either out-of-reach or turning residents into distressed renters.
Worse still are markets like New York, LA, the Bay Area and San Bernardino – Riverside. These four markets are unaffordable for households around their respective median incomes all the way down to Class D properties. This means 70% of conventional properties are too expensive for these residents.
To put that into perspective, a household earning the median income of $96,000 annually in the Bay Area could be paying about 32% of their gross income for a Class C apartment, 41% of net income. To reiterate, ALN price classes refer only to a property’s market percentile for rent per square foot.
The Borderline
It’s clear there are some markets well away from an affordability issue, and some in the midst of one. There are also a handful of areas trending toward affordability issues. Tampa, Providence, Seattle, Sacramento and Portland are each approaching the affordability threshold. Like the Florida markets mentioned previously, Tampa is the only market of this group with households with annual income above $150,000 making up less than 10% of households. Tampa is also the only market in this group with a median household income below $62,000—coming in at about $50,000.
It bears mentioning that a market simply being under this affordability threshold doesn’t necessarily mean households around the average income have a variety of affordable options to choose from.
Additional Nationwide Context
The large difference between wage growth as a percent and rent growth as a percent is sometimes used in affordability discussions as a tool to paint a fairly dire picture. And that can be a compelling juxtaposition. In a three-year period, median monthly effective rent has risen by 26% nationally. During that time, median household income has risen by more than 5%, using an estimate for 2018 income growth.
But what does that mean in actual dollars? At the median, households lost around a net $35 per month in purchasing power due to rent. $500 per year in lost purchasing power is something but isn’t a massive amount.
Another interesting observation from the data is that median effective rent has gone up by 26% over the last three years, but average effective rent has gone up by only 15%. This is an indication the most expensive markets may be approaching a ceiling for rents, whereas rents in more affordable markets have continued their climb.
Takeaways
In some of the largest coastal cities, the supply of affordable units for price-sensitive renters who don’t qualify for any rent subsidies is very low. On the other end of the spectrum, many of the areas in the Midwest continue to be the most affordable. A positive is that of these 50 most populous markets, 42 of them remain below the 30% measure.
It’s likely that strong rent gains are going to be increasingly centered around markets between the coasts with healthy economic activity as we move through the remainder of the current cycle.
*Price class (A, B, C, D) is calculated based on market percentile for rent per sq ft with A = top 12%, B = next 20%, C = next 38% and D = bottom 30%
ALN OnLine makes it easy to research individual properties, submarkets, markets and more – available nationwide and with flexible pricing options!
Disclaimer: All content and information within this article is for informational purposes only. ALN Apartment Data, Inc. makes no representation as to the accuracy or completeness of any information in this or any other article posted on this site or found by following any link on this site. The owner will not be held liable for any losses, injuries, or damages from the display or use of this information. All content and information in this article may be shared provided a link to the article or website is included in the shared content.

