

Tracing the Contours of Improved Apartment Demand
The impact of two developments for the multifamily industry this year has been widely felt. One has been the beginning of a slowdown in new supply after its 2024 peak. That slowdown was anticipated, and its scale has largely played out to expectations. The other is a rise in apartment demand. Though further improvement after annual gains in both 2023 and 2024 was expected, the scale of the increase has surprised to the upside.
As a methodological note, apartment demand here is used interchangeably with net absorption. Though net absorption is a subset of apartment demand in a more technical sense, its more colloquial use within the industry is used here. Also, all numbers will refer to conventional properties of at least fifty units.
View the full monthly Markets Stats PDF
National Net Absorption
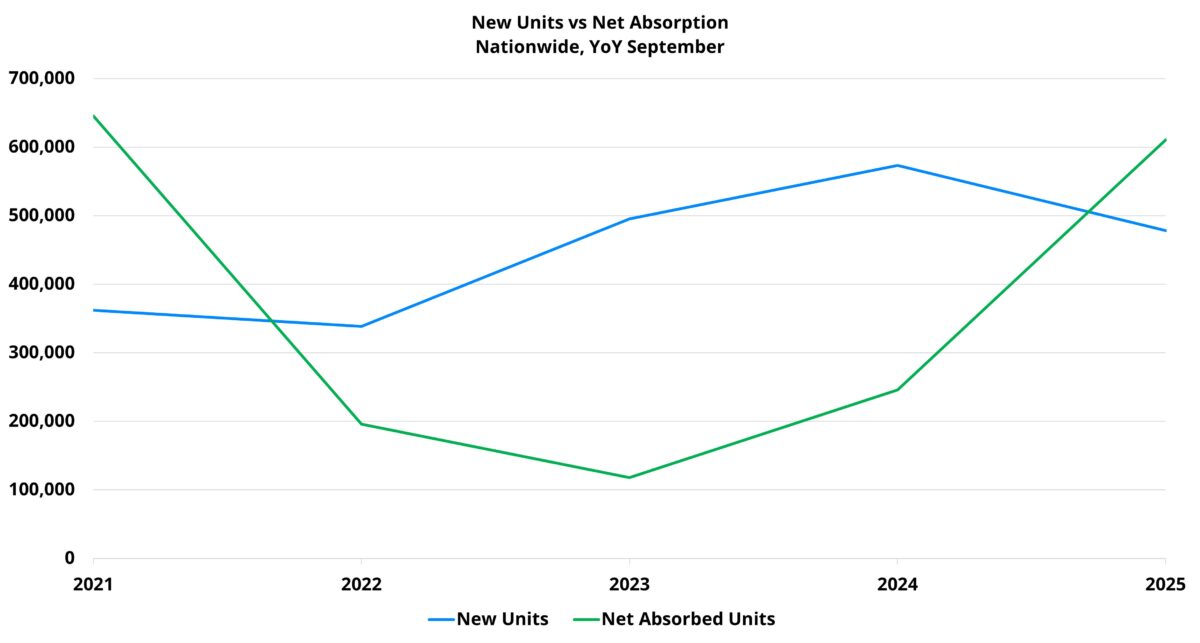
Through September, more than 580,000 net units were absorbed across the country. That more than doubled last year’s total through the same portion of the calendar and fell only slightly short of the 2021 value. Coming into the year, further gains were expected for apartment demand. However, a year rivaling the eye-popping absorption of 2021 has come as a surprise.
Zooming out a little more returns a similar picture. Year-over-year absorption for September topped 600,000 units nationally. That was more than double the previous twelve-month period and fell short of only 2021 among recent years.
This sustained uptrend that is now nearing its third full year has occurred within the context of both economic and geopolitical uncertainty. A frozen for-sale market on the single-family side, the return of real wage growth, a reasonably tight labor market in recent years, and the benefit of unrealized demand from 2022 and 2023 have all played a role. Perhaps most notable has been the widespread nature of the recent demand surge.
Price Class Performance
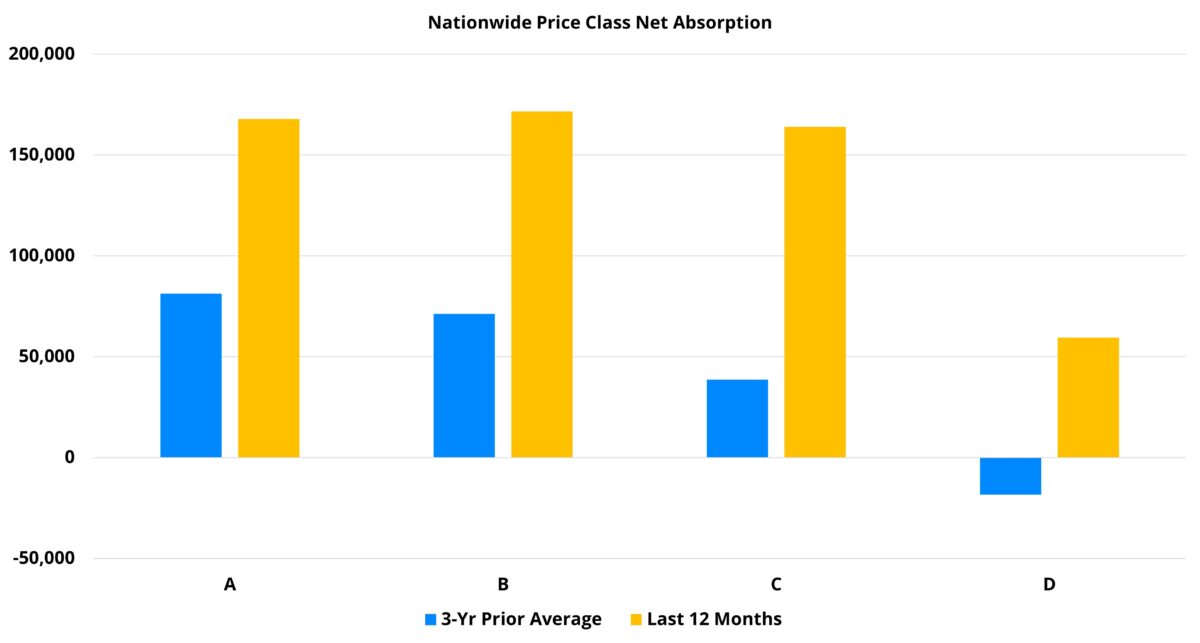
Unique among the four price classes, Class A net absorption over the last twelve months has surpassed the same period ending in September of 2021. More than 165,000 net units were absorbed over the last year compared to just more than 135,000 net units in the twelve months ending in September of 2021. This robust demand was timely given both the continued delivery of new units and the accumulated backlog of new properties in a lease-up phase.
The Class A subset was unique in reaching peak demand over the last twelve months, but the other price classes performed well too. For the middle two price tiers, year-over-year net absorption more than doubled the previous twelve-month period. For each, recent absorption was higher than in any recent year except for 2021.

Join Director of Market Analytics, Jordan Brooks, on December 2, 2025 for a clear, data-driven review of how the multifamily market performed in 2025 and what that means for 2026.
A feature identified in the January edition of this newsletter that merited watching this year was Class D net absorption. As the recovery in apartment demand picked up in recent years after bottoming out in 2022, the top of the market was the first to bounce back. Class C turned the corner in 2024. Class D showed improvement last year, but notable positive absorption remained elusive.
This year, Class D net absorption joined the party as well. Zooming out a little further to the last twelve months, net absorption for that subset of properties reached almost 60,000 units nationally. That result followed a total of less than 10,000 net units in the previous annual period.
Market Tier Performance
Another perspective from which net absorption performance has been widely encouraging is market tier. When primary, secondary, tertiary, and micro markets are grouped into those four categories, improvement has been ubiquitous.
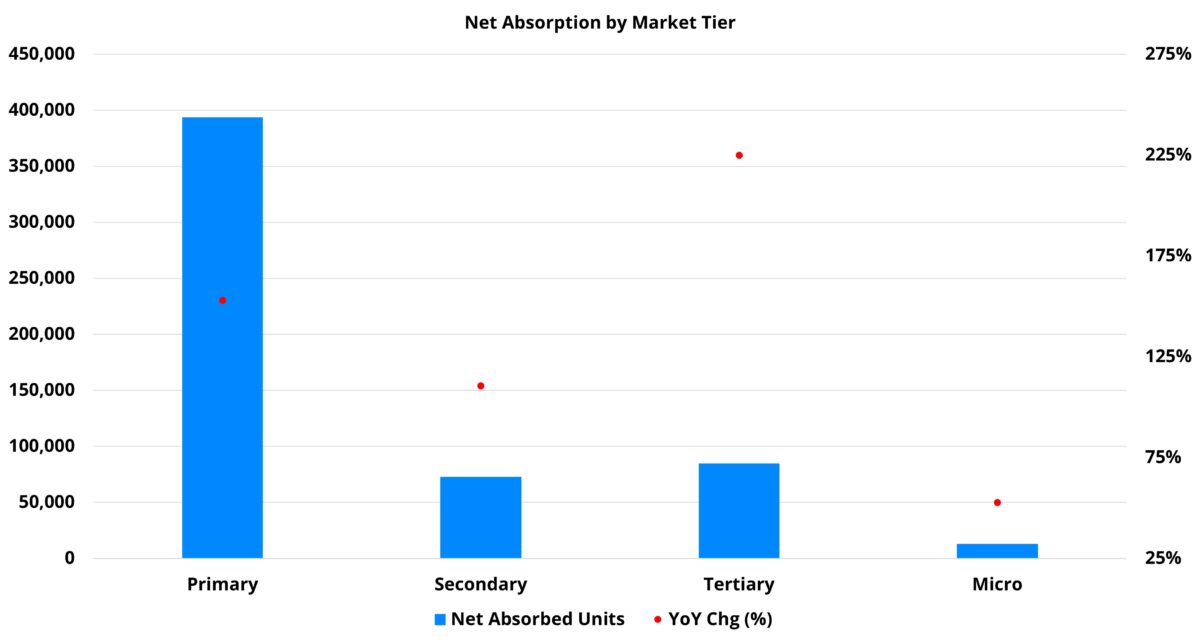
Tertiary markets stood out. Net absorption over the last year of approximately 85,000 units was more than three times higher than the total from the previous twelve months. The result from the last twelve months was also the highest of the last five years. In terms of the top performing markets, the top ten in year-over-year improvement were all Sunbelt markets.
Primary markets, of course, continued to be the engine of aggregate demand. Even on a percentage basis, the recent absorption gain was impressive. Nearly 400,000 net units were absorbed across primary markets in the last year. That more than doubled the previous annual result and was the second highest of the last five years.
For secondary markets, net absorption of more than 70,000 units through September roughly doubled the net absorption from the previous annual period. The top year-over-year gainers for secondary markets were similarly skewed toward Sunbelt markets. However, both St. Louis and Grand Rapids managed to crack the top ten.
Micro markets showed improvement as well. Total net absorption of around 13,000 units was obviously more modest. Even so, that marked a more than 50% year-over-year improvement. As with tertiary markets, recent net absorption was the highest total of the last five years.
Takeaways
New deliveries have started to decline this year, as was expected. Apartment demand has improved this year, also in line with expectations. The scale of the absorption gain has been surprising, though.
One aspect that has been encouraging about the demand improvement is that it has come after annual gains in both 2023 and 2024. Rather than being a potentially anomalous blip, this year’s performance has continued a multi-year uptrend.
Also encouraging has been the widespread nature of the improvement. Year-over-year gains have been observed across all four price classes, across markets of all sizes, and across all NAA regions. Rather than one or two subsets driving the positive results, the rising tide of apartment demand has lifted all boats.
There is certainly some question as to whether this trajectory can be maintained moving forward. Cracks have emerged in the employment environment. Inflation continues to bounce around more than would be ideal, and much uncertainty remains in terms of the trade environment and geopolitics more broadly. Additionally, as new supply continues to trend downward, that may ultimately provide a headwind for net absorption as well.
Nevertheless, after some time in the demand doldrums, it is hard to view the developments of 2025 thus far in anything but a positive light.
Disclaimer: All content and information within this article is for informational purposes only. ALN Apartment Data makes no representation as to the accuracy or completeness of any information in this or any other article posted on this site or found by following any link on this site. The owner will not be held liable for any losses, injuries, or damages from the display or use of this information. All content and information in this article may be shared provided a link to the article or website is included in the shared content.
Transform your budget season planning approach with comprehensive market intelligence. Schedule a personalized ALN OnLine demonstration and discover how data analytics can elevate your strategic decision-making.
Continue Your Strategic Planning Journey: