

New Supply Slows but Lease-up Backlog Remains
The most prominent driver of multifamily performance over the last few years has been new supply. The sustained deluge of new units that entered the market across the country in recent years was unlike anything seen since the peak years of the 1970s and 1980s. This surge in supply was paired with inconsistent apartment demand which was wholly unable to keep pace with deliveries.
So far in 2025, that dynamic has started to shift. For the first time since 2021, apartment demand has outpaced new supply though July. This shift has materialized thanks both to a slowdown in new supply and continued positive momentum for demand. Last month’s newsletter is a good resource on these themes. This month, the focus will be a closer look at the new construction pipeline as it is currently constituted, and what it portends for upcoming supply.
View the full monthly Markets Stats PDF
National Pipeline Breakdown
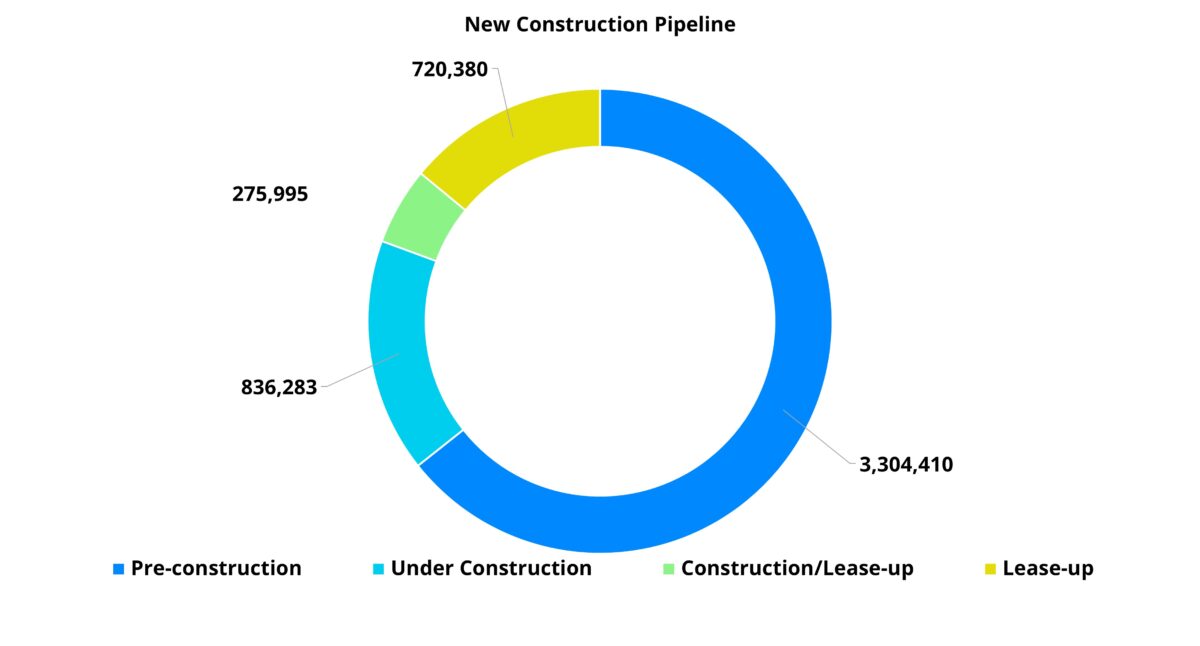
ALN is currently tracking more than five million units in the construction pipeline nationally. As is typical, more than half of those units are in a pre-construction phase. This means they have yet to break ground and are in some form of planning, research or permitting.
This portion of the pipeline is less relevant to near-term supply because these units may be delayed or canceled and the projects that do eventually break ground will generally not be entering the market for at least two years. In total, approximately 3.3 million units are currently in this phase.

Explore the tools and insights with ALN OnLine designed to help you plan, build, and optimize your multifamily budgets with confidence.
Roughly one million units are currently in some phase of lease-up. This is the portion of the pipeline that tends to be overlooked in discussion around new supply. More attention is typically paid to construction starts or permitting numbers. These leading indicators are important, but they provide context for expectations two-to-five years into the future.
In the shorter term, the new supply that impacts multifamily performance is comprised of new properties trying to fill their units and properties already under construction. A backlog of lease-up properties means that projects still under construction face the prospect of coming online in a relatively soft environment for their own lease-up phase.
About 830,000 additional units are currently under construction but not yet leasing. These units represent the new supply already baked in for the next few years. Nationally, the average construction duration is currently about nineteen months – three months longer than was the case five years ago. Below that national average, a lot of variance exists at the market level. Nevertheless, most units under construction can generally be expected to begin leasing within twenty-four months.
Expectations for Upcoming Supply
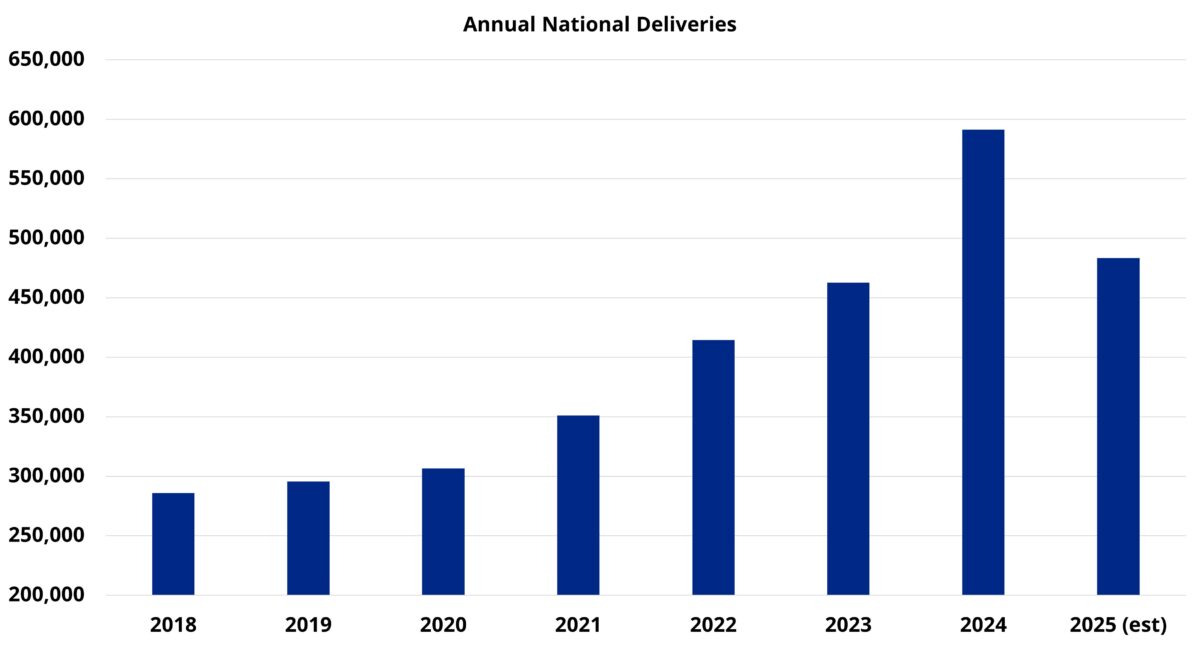
Around 270,000 new units were delivered nationally this year through July. Another 230,000 units or so are anticipated to begin leasing before the end of the year. That would bring the 2025 annual total to about 485,000 new units. That level of new supply would represent a decrease of more than 100,000 units compared to 2024 – an 18% year-over-year decline.
Even so, annual deliveries in 2025 will be the second highest of any recent year behind only 2024. For additional context, the roughly 270,000 new units introduced in the first seven months of this year was only about 30,000 units fewer than the annual total from 2019. That year’s new supply will likely be surpassed once August data is in with a third of the year remaining.
In 2026, national new supply is poised to surpass 400,000 units for a fifth consecutive year. With more than 800,000 units currently under construction, the slowdown in new supply from its 2024 peak will be more modest than simply turning off the spigot. The tone in analysis of the slowdown will largely depend on the metric that is most focused on. Looking primarily at the number of new units delivered will reflect a new supply environment that is still quite elevated. Looking at year-over-year percent change in deliveries will accentuate the slowdown.
2025 provides a good example. If the rest of the year plays out to expectations, new supply this year will be the second highest annual total in more than twenty-five years. On the other hand, this year’s new supply will be almost 20% lower than last year’s with a margin of more than 100,000 fewer new units.
Market Highlights
The usual suspects occupy the top three spots for units currently under construction. New York, Dallas – Fort Worth, and Los Angeles – OC are often at the very top of the list. More notable are the markets that are not inside the top ten. Houston, Nashville, Raleigh – Durham, Tampa, and Seattle have typically been higher in the rankings than they currently are.
Still in the top ten for units under construction are other Sunbelt markets like Phoenix, Charlotte, Miami, Austin, Atlanta, and Orlando. The region remains well represented at the top of the list despite some of the aforementioned areas being a bit lower than has been the case in recent years.
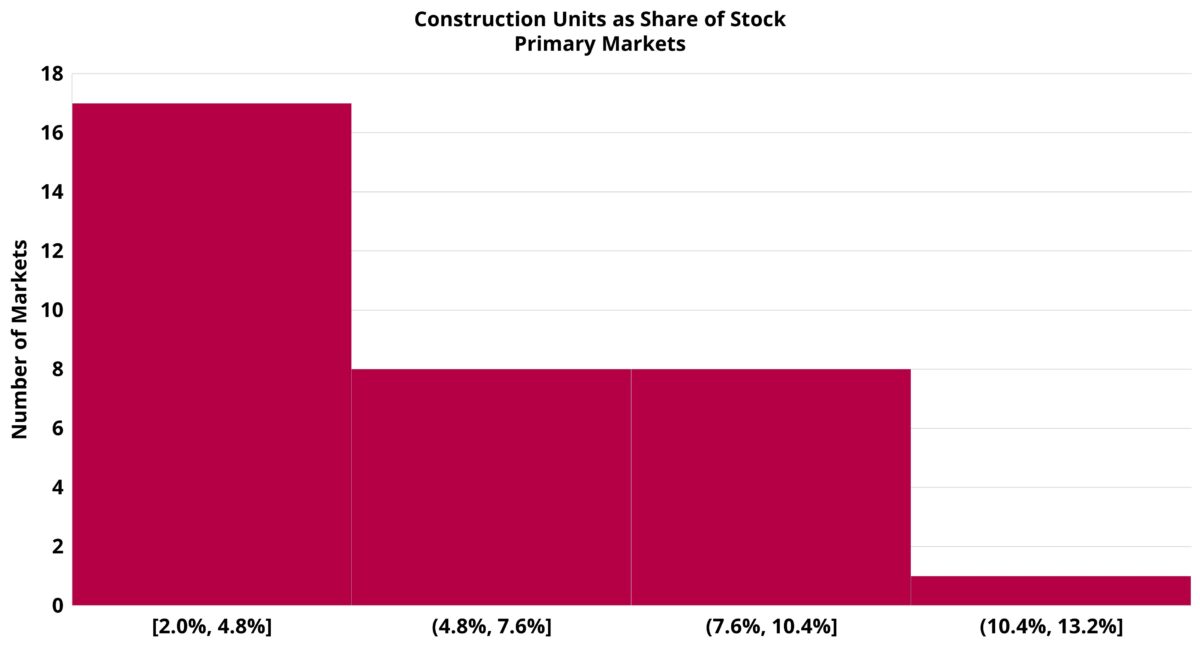
Sticking with the Sunbelt, the fact that certain markets are not as high in the rankings as they were at their absolute peak of construction activity does not mean the new supply pressure is over for those areas. When considering the number of units under construction relative to existing stock, many of those markets shoot right back to the top of the list nationally. Charlotte leads the way among primary markets. The units currently under construction there equal about 11% of existing stock. Nashville, Raleigh – Durham, and Phoenix have supply equal to 10% of existing stock currently being built. That metric for Tampa sits at 9% and at 8% for Austin. All these markets are in the top ten nationally among primary markets in this size-adjusted metric.
On the other end of the spectrum, many of the Midwest markets are set to continue seeing relatively low new supply over the next couple of years. There are a few noteworthy markets down there with them though. Houston has just 3% of current stock currently under construction. That metric for Las Vegas sits at 4%, and at 5% for San Antonio.
Takeaways
New supply has started to recede from last year’s peak, but expectations for the slowdown should be properly oriented. The industry is not in a situation where new deliveries will be falling off a cliff with a dramatic shift from supply pressure to under supply. Rather, new deliveries will moderately decline this year and probably again in 2026. The construction starts data in the coming months will shed additional clarity on the 2027 outlook.
Along with moderate decline in new supply, a sizeable backlog of lease-up properties remains. The average lease-up duration nationally is currently about seventeen months. Over the last seventeen months, about 780,000 new units have been delivered. So, the backlog is not extreme, but those units will impact projects set to come online soon.
Overall, a decline in short-term supply will be helpful to allow some markets to catch up and rebalance. If the positive demand momentum that has grown for more than two years continues, the bottom for annual deliveries may not be as low as some expected even a short time ago.
Disclaimer: All content and information within this article is for informational purposes only. ALN Apartment Data makes no representation as to the accuracy or completeness of any information in this or any other article posted on this site or found by following any link on this site. The owner will not be held liable for any losses, injuries, or damages from the display or use of this information. All content and information in this article may be shared provided a link to the article or website is included in the shared content.
ALN Apartment Data delivers industry-leading multifamily market intelligence, empowering thousands of apartment industry professionals with accurate, research-driven insights.
- Owners and Management Companies leverage ALN OnLine for property search, rental market analysis, and competitor benchmarking—ensuring data-driven decision-making. Discover more about ALN OnLine here
- Multifamily Suppliers & Service Providers trust Vendor Edge Pro to identify property management companies, target apartment communities, and optimize B2B sales strategies with our curated data and must-have features like sales routing. Get started with Vendor Edge Pro today
- Enterprise-Level Multifamily Suppliers scale their business with Compass, the ultimate tool for nationwide property and management company insights, targeted prospecting, and market expansion strategies. Explore Compass now
Not sure how we can help you? Learn more about all of our services for Multifamily Professionals