

An Encouraging Third Quarter for Multifamily
With the third quarter officially in the books, 2024 is quickly approaching its end point. Despite remaining challenges, the third quarter featured some reasons for encouragement in the industry performance data. In particular, apartment demand continued its robust improvement from generational lows.
All numbers will refer to conventional properties of at least fifty units.
View the full monthly Markets Stats PDF
New Supply and Net Absorption
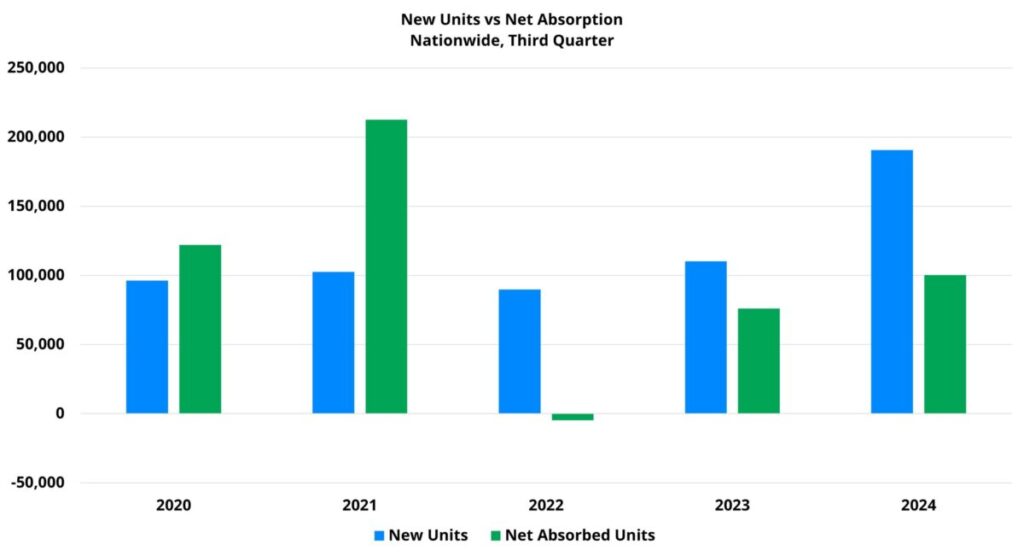
As expected, the multifamily new construction pipeline deliver a huge number of new units in the quarter. 2024 is likely to represent the peak for national deliveries in this development cycle, and the third quarter saw more new units delivered than in any quarter in recent years. Approximately 191,000 new units were introduced across the country – up from around 162,000 new units in the second quarter. About 475,000 new units have been added in just nine months this year. Last decade, that would have been a massive total for a whole calendar year.
The main bright spot for industry performance in the quarter was apartment demand. Just more than 100,000 net units were absorbed in the period. Absorption has improved consistently throughout the year along the usual seasonal schedule for multifamily and the third quarter total was the highest of any quarter since 2021. The robust results of the last few months provide a positive indication that after a net loss of leased units in the final quarter of both 2022 and 2023, that streak may end in 2024.
Net absorption in the period amongst properties that entered the year already stabilized was even more encouraging. Apartment demand has been particularly skewed toward lease-up properties recently. In fact, in both 2022 and 2023, annual net absorption was negative for stabilized properties. Through the first three quarters of 2024, stabilized net absorption totaled around 59,000 units.
Stabilized net absorption generally peaks in the second quarter whereas overall net absorption usually peaks in the third quarter. This held true in 2024, with stabilized net absorption falling from the second to third quarter. However, the third quarter total this year compared favorably to recent years. Not only did this year outperform 2022 and 2023, but it also bettered 2017 and 2019.
Average Occupancy
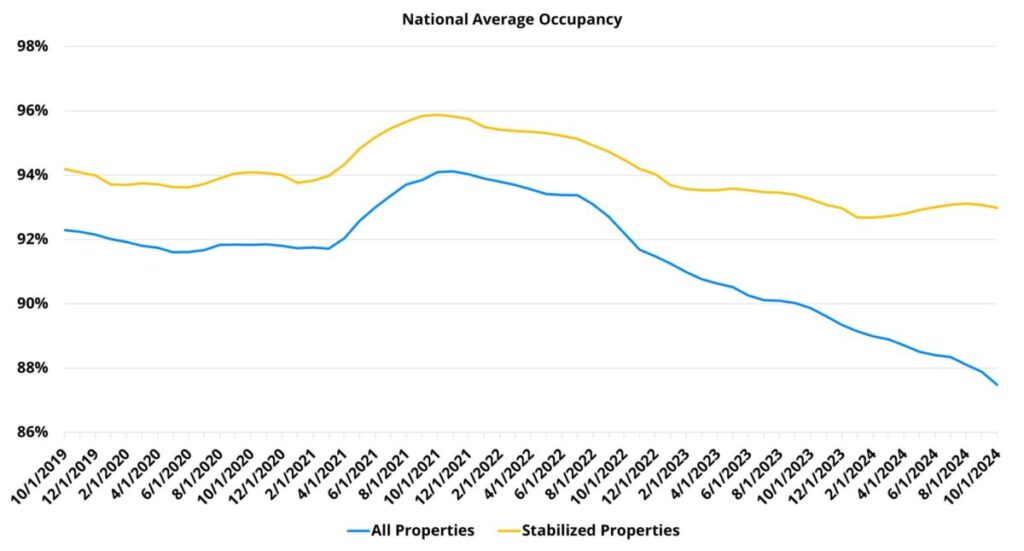
Despite the improvement in apartment demand, average occupancy continued to fall due to the scale of new supply. A sixty-basis point decline in overall average occupancy during the quarter brought the national average to 87.9% to end September.
On a year-over year-basis, a 2.3% decline over the last twelve months represented a modicum of improvement from the 2.9% decrease for the prior twelve-month period. With new supply possibly ramping up further in the final quarter of the year, and apartment demand expected to cool from its third quarter level, the bottom for national average occupancy is almost certainly not yet in for 2024.
For properties that entered 2024 already stabilized, a 0.1% increase resulted in an average occupancy of 93%. This small gain was enough to make the period the third straight quarter to avoid an average occupancy decline – an occurrence last achieved in 2021.
As with overall average occupancy, the stabilized rate is expected to decline in the final quarter of this year, though to a much smaller degree. Stabilized net absorption has been negative in the fourth quarter in each of the last seven years and is likely to be the same this year. Nevertheless, the turnaround in stabilized net absorption that has occurred this year, and the associated shift in the average occupancy trend has been one of the key developments of 2024 for the multifamily industry.
Average Effective Rent
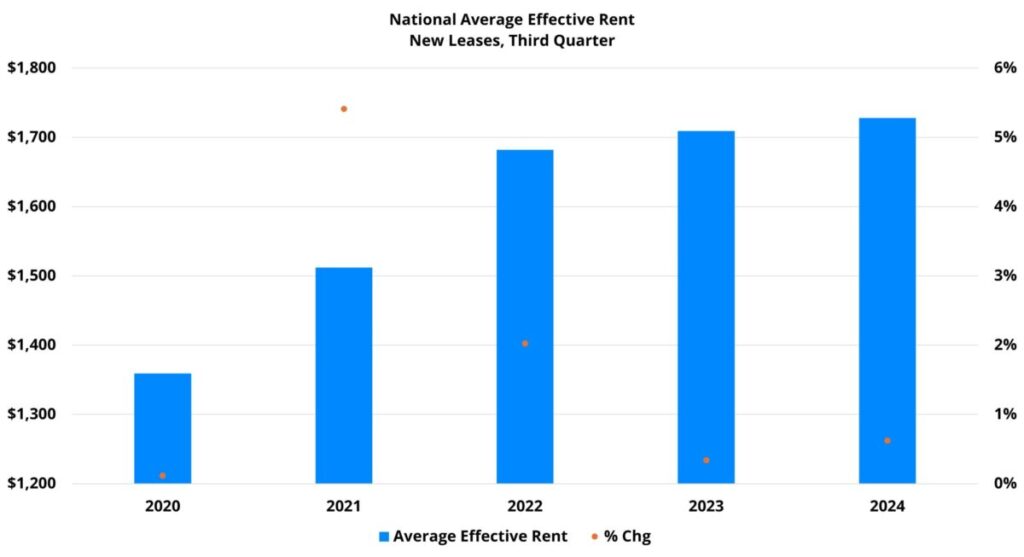
Apartment demand has improved this year, but that improvement has come at the expense of rent growth. Average effective rent rose by 0.6% in the third quarter and has gained 1.1% over the last twelve months. Both figures were well below their respective long-term averages.
One area of note in the rent performance data was price class. Rent growth has been most resilient at the top of the market. For both Class A and Class B, third quarter average effective rent growth for new leases was about 1%. For each, that 1% gain was right in line with rent performance in the 2017 – 2019 period.
For the bottom two price tiers, rent growth has been more muted. The Class C subset managed a 0.3% gain in the period while the Class D group saw an average effective rent decline of 0.5%. For Class C, this year’s result was tied with 2023 for the lowest in recent years. For Class D, this year’s result was the first negative move for a third quarter in recent years.
An unfortunate dichotomy emerged between the top two price tiers and the bottom two in the quarter. Rent growth was stronger at the top of the market and that rent growth came alongside demand improvement. For the bottom two tiers, an underperformance in rent growth was paired with a decline in apartment demand quarter-over-quarter.
Lease Concessions
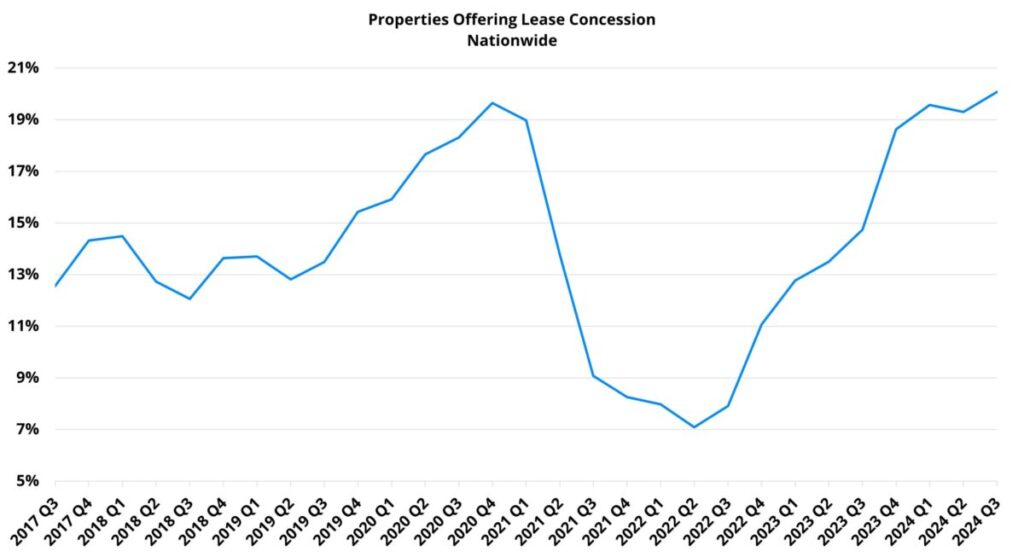
Lease concessions continue to be a major component of the rent growth story. A 4% increase in the availability of discounts for new leases was smaller than the increase in the same portion of 2022 and 2023. On the other hand, a 4% increase in the average lease concession value was the largest of any third quarter since 2020.
With about 20% of conventional properties nationwide offering a discount for new leases to end September, concession availability ended the quarter at its highest point in more than seven years. Only the fourth quarter of 2020 and the two opening quarters of this year came close. In all likelihood, availability will be even higher by the end of the year.
The average concession value finished the period at about 3.6 weeks off an annual lease. As with concession availability, this metric is on the high end of its recent range. Not since its peak in late 2020 and early 2021 has the average concession value been this high. Even with an anticipated increase in the fourth quarter, 2024 should at least avoid matching the aforementioned pandemic era peak when the average discount exceeded four weeks off a twelve-month lease.
Takeaways
The third quarter provided some reason for optimism for a multifamily industry that has muddled through the last few years. Apartment demand has shown sustained and notable improvement this year. The progress made by stabilized net absorption has been especially promising. Below-average rent growth is never cause for celebration, especially as operating expenses remain high. Yet, the silver lining to cooler rent growth has been the simultaneous positive response from demand.
However, challenges certainly remain. The new construction pipeline will not be relenting until probably the back half of 2025. This means that over the next six months or so, average occupancy will have a hard time clawing back much of the ground that has been lost over the better part of three years now.
Also, despite real improvement over the last twelve months, net absorption and rent growth for Class C and Class D remain well below their pre-pandemic levels. This is especially true for Class D. These segments are trending in the right direction, but further progress is needed.
Disclaimer: All content and information within this article is for informational purposes only. ALN Apartment Data makes no representation as to the accuracy or completeness of any information in this or any other article posted on this site or found by following any link on this site. The owner will not be held liable for any losses, injuries, or damages from the display or use of this information. All content and information in this article may be shared provided a link to the article or website is included in the shared content.