

Uneven Performance Between Price Classes
2024 has been an interesting year for the multifamily industry. A construction boom not seen in decades is cresting while demand has steadily improved since bottoming in 2022. Also, rent growth is at least in positive territory despite average occupancy being at its lowest point in more than a decade.
Below these national broad strokes, there have been some interesting developments at the price class level. All numbers will refer to conventional properties of at least fifty units.
View the full monthly Markets Stats PDF
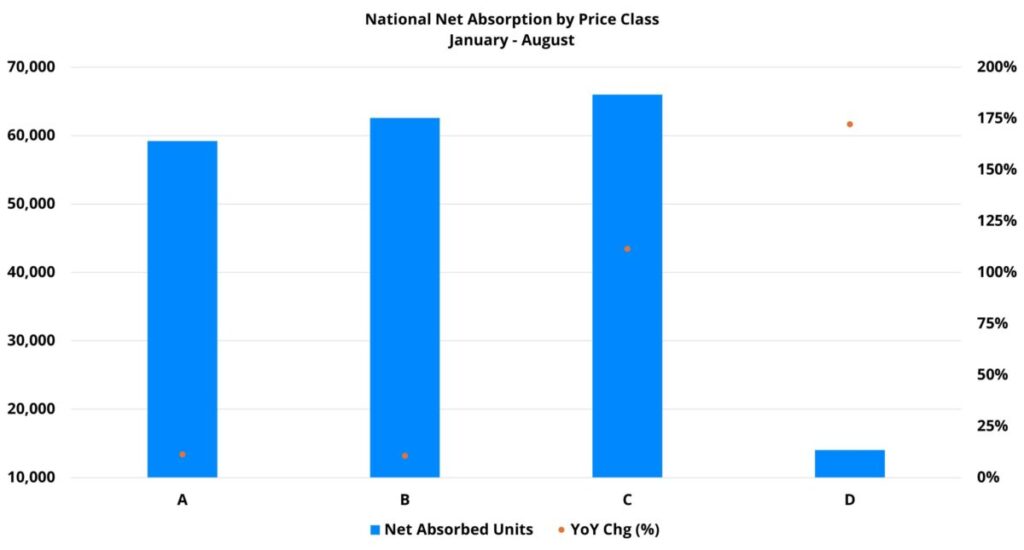
Net Absorption
Apartment demand has increased from last year across the price classes. However, the most robust improvement has come within the bottom two tiers. Last year through August, net absorption for Class C properties nationally was just over 31,000 units. During the same portion of this year, that total crossed 66,000 units. Similarly, for Class D properties, a net loss of nearly 20,000 leased units in the first eight months of 2023 gave way to a net gain of just more than 14,000 leased units this year. Two markets in which net absorption within these two price tiers has been especially strong relative to the rest of the country were Austin and Orlando.
Apartment demand improved from last year at the top of the market as well, but to a much smaller degree. A little more than 53,000 net units were absorbed in the Class A subset through August of last year. This year, nearly 60,000 net units were absorbed. On a percentage basis, the uptick for Class B was almost identical. Net absorption of just less than 57,000 units last year was followed by almost 63,000 net absorbed units in the same portion of this year.
There was a clear regional skew in the top performing markets for Class A and Class B demand. Half of the top ten markets were in the Great Lakes region: Dayton, Cleveland, Minneapolis – St. Paul, and Indianapolis. Other usual suspects near the top of the list as well were markets such as Nashville, Orlando, Charlotte, and Phoenix.
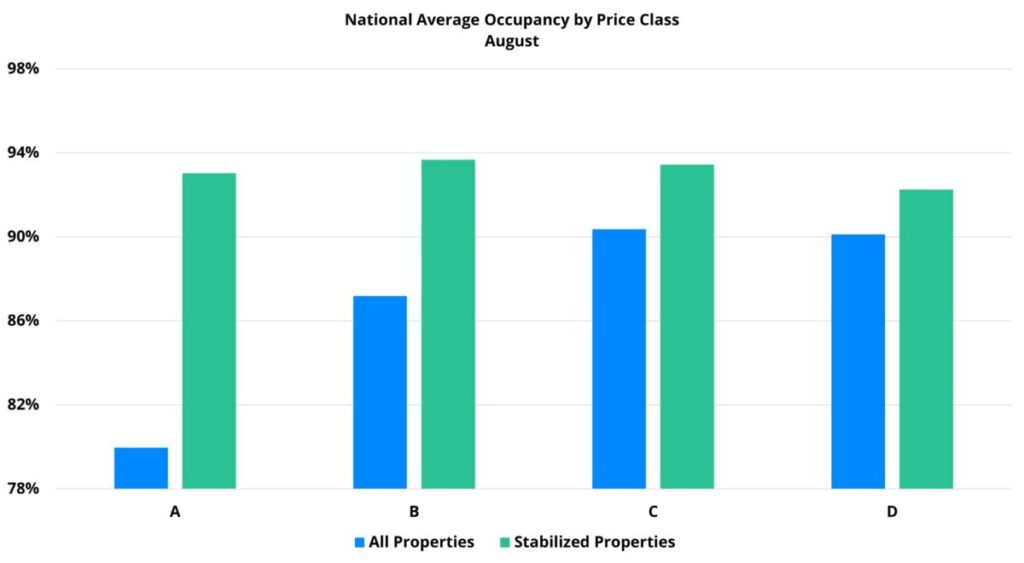
Average Occupancy
There was a stark difference in price class average occupancy at the end of August and it was almost entirely due to new supply. Overall average occupancy finished the period at just 80% for Class A and 87% for Class B. The bottom two tiers were moderately higher with average occupancy at about 90% for each.
When isolating just those properties that began the year already stabilized, the four price classes ended August with much more similar average occupancy. The Class D average, at about 92%, was the lowest. The remaining three tiers each had a stabilized average occupancy between 93% and 94% – with Class B leading the way at almost 94%. Encouragingly, net absorption so far in 2024 has been positive across the board for stabilized properties after both the Class C and Class D subsets suffered a net loss of leased units for stabilized properties in the same period last year.
Despite the absorption improvement and the solid stabilized occupancy averages, the workforce housing segments feature some unusually low average occupancies in certain markets.
In general, these are the high-supply Sunbelt markets where an aged development cycle has meant that more new supply has come into lower average rent and more outlying submarkets. Because ALN calculates price class at the market level, new properties can be delivered at the top of their submarkets in average rent but outside the top one-third of properties that constitute the Class A and Class B groups.
Another common reason for unusually low average occupancy in these segments, particularly Class D, has been sustained negative net absorption at the market level during the last two years. Examples are numerous, but include markets like Tampa, Olando, Charlotte, Raleigh – Durham, Austin, Phoenix, and Atlanta.
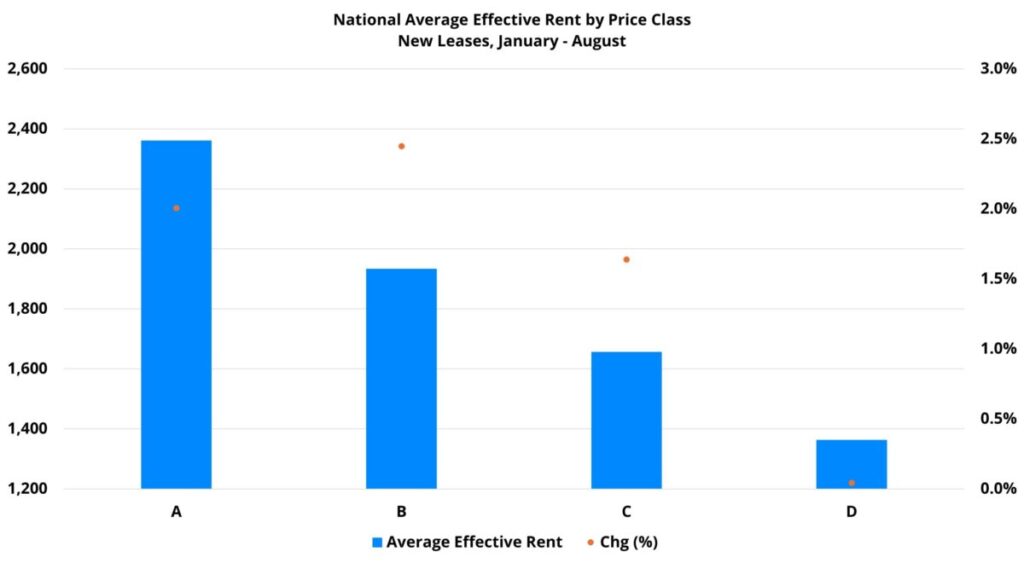
Average Effective Rent
Average effective rent performance for new leases so far this year across the price classes has been the inverse of demand performance. The substantial improvement in net absorption for Class C and Class D has come at the expense of rent growth. At the top of the market, where demand improvement has been more modest, rent performance has been better.
The Class A group managed a 2% average effective rent gain through August 2024. This surpassed last year’s 1.5% gain at the same point in the calendar but was also lower than the pre-pandemic years of 2018 and 2019 – to say nothing of the heady 2021 and 2022 period. Class B was much the same. A 2.5% average effective rent gain was higher than last year’s 1.9% increase by the same margin as for Class A. This year’s mark was also on the low end of the spectrum from recent years.
The bottom two price tiers have underperformed relative to last year. A 1.6% average effective rent gain for Class C followed last year’s 1.9% appreciation through August. For Class D the average effective rent has remained unchanged through eight months of this year. Uniquely among the price classes, this result fell short of even 2020. At the market level, Class A and Class B rent growth has been almost ubiquitously positive so far in 2024. In Atlanta, both were negative. Class A rent growth was negative In Raleigh – Durham, Tampa, Charlotte, and Austin.
For the workforce housing segments, once again the laggards were heavily concentrated in the Sunbelt. Markets like Austin, Dallas – Fort Worth, San Antonio, Nashville, Atlanta, Charlotte, and Tampa each saw average effective rent decline for both Class C and Class D. Nearly ten other markets had either Class C or Class D slip into negative territory for rent growth so far this year. A handful are familiar names already mentioned elsewhere. Those not already mentioned include Baltimore, Houston, Denver, and Las Vegas.
Takeaways
Some interesting differences have emerged across the price classes so far this year. Net absorption, while up year-over-year across the board, has shown particular improvement within Class C and Class D. However, that improvement has come at the expense of rent growth. Still a better outcome than tepid rent growth without a bounce in demand.
For Class A and Class B, while rent growth has been more modest – it has at least been captured along with some demand improvement. More encouraging is that despite accounting for less total units, the top two price classes represent a majority of net absorbed units.
There has also been some regional variance within the price classes. The Great Lakes region has performed especially well in net absorption within the top two price tiers. High-supply Sunbelt markets continue to feel that supply pressure as it takes a toll on both occupancy and rent across the price class spectrum.
With the end of the year rounding into view, the workforce housing segments are showing some encouraging signs of life yet 2024 multifamily performance is shaping up to be driven mostly by the top of the market.
Why choose ALN for Budget Season?
Our flagship platform’s roots go back to 1996 when we were among the first research firms to digitally provide data in the multifamily industry. Since then, we’ve helped countless multifamily professionals transform their budget season from a daunting task to an opportunity for growth and optimization.
Disclaimer: All content and information within this article is for informational purposes only. ALN Apartment Data makes no representation as to the accuracy or completeness of any information in this or any other article posted on this site or found by following any link on this site. The owner will not be held liable for any losses, injuries, or damages from the display or use of this information. All content and information in this article may be shared provided a link to the article or website is included in the shared content.