Q1 Brought a (Somewhat) New Reality for Multifamily
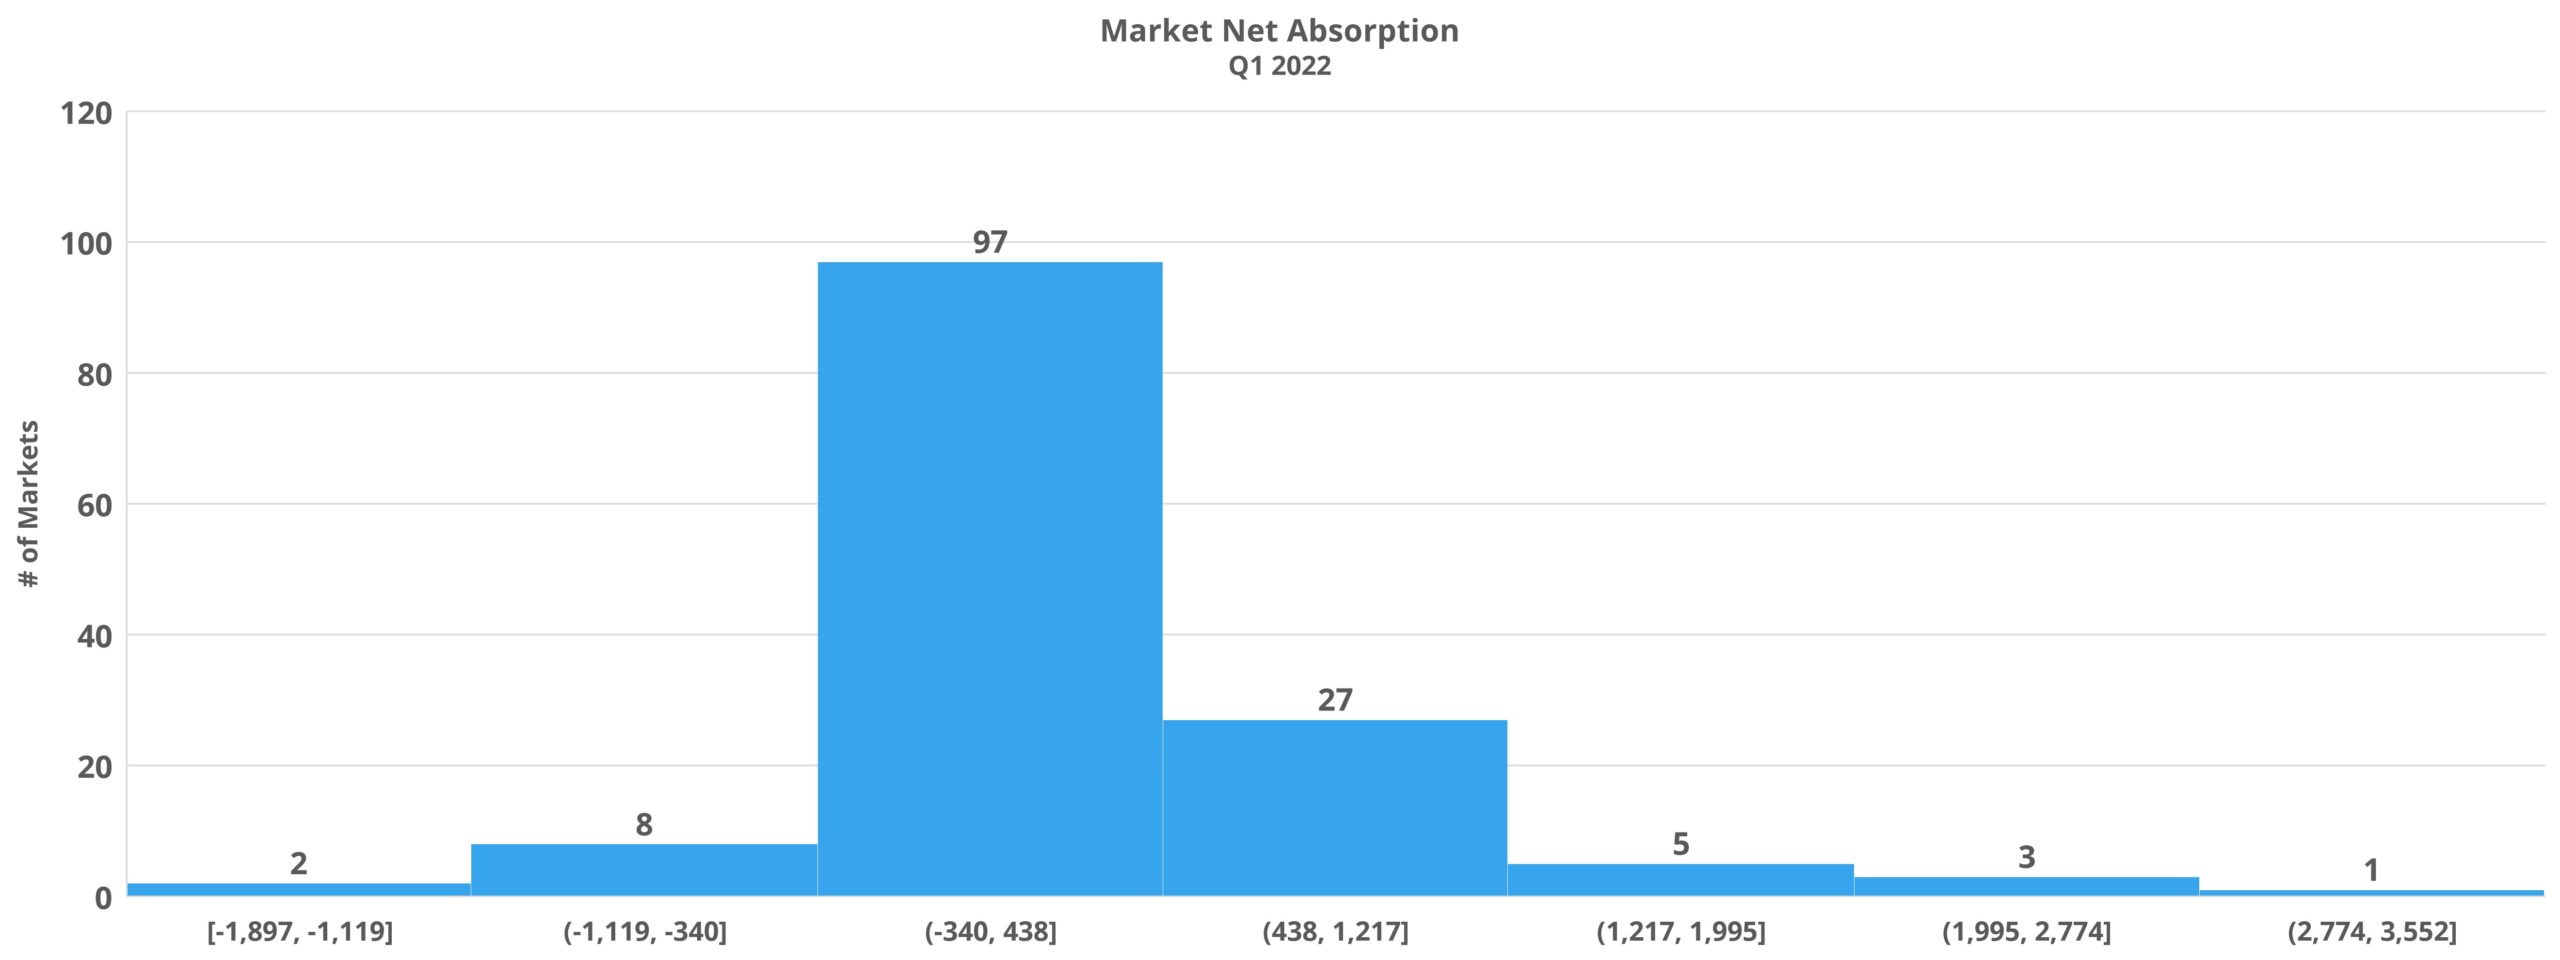
As has been discussed in recent newsletters and blog posts, the change of the calendar corresponded with a change in the apartment demand picture nationally. Though lease concession availability continued to winnow and rent growth showed no signs of abating in the opening quarter of 2022, about 40% of markets around the country experienced negative net absorption. Because generational apartment demand in 2021 was the main driver of multifamily performance last year, the shift in dynamic will have a profound impact on the industry this year if it persists.
As usual, all numbers will refer to conventional properties of at least 50 units.
National Apartment Demand
With about 32,000 net absorbed units, Q1 2022 had the lowest demand total in more than five years by a wide margin. That level of apartment demand represented a 65% decline from the opening quarter of 2021 and about a 40% decline from net absorbed units in the first quarter of 2020. Even with a significant drawdown in new deliveries in the period compared to 2020 and 2021, national average occupancy fell 0.5% to just under 94% to end March.
View the full monthly Markets Stats PDF
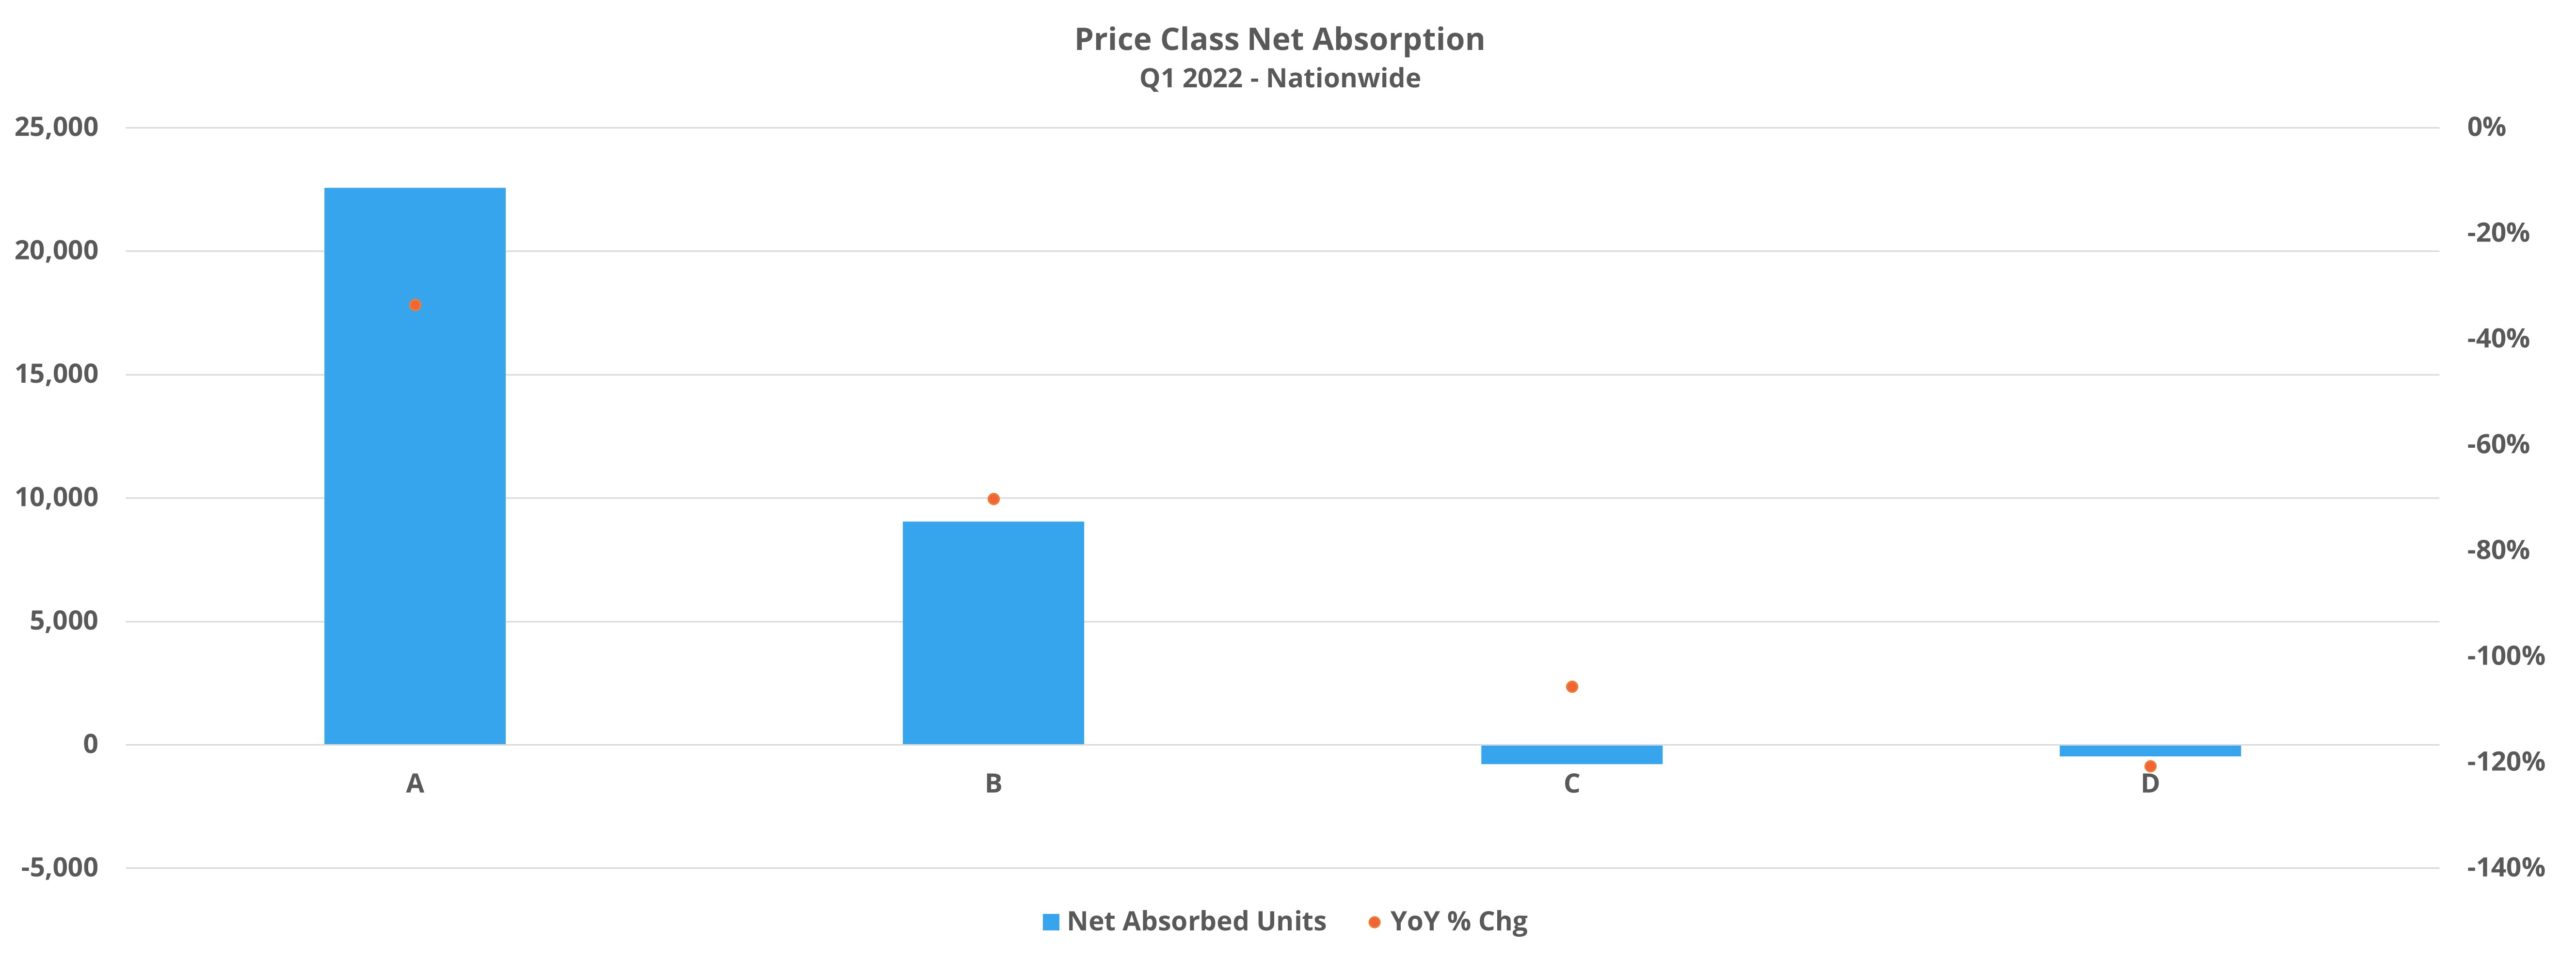
The drop off in absorption was notable across the price classes, but Class C and Class D each moved into negative territory for the quarter – though by a small margin. For the Class D segment, this year marked the second time in the last five in which first quarter net absorption was negative, with only 2020 experiencing a worse result. For Class C, a net loss of approximately 800 leased units was the first time in the five-year period first quarter demand was negative.

Class A led the way in apartment demand with almost 23,000 net absorbed units, down from around 34,000 units in the first three months of 2021. In terms of net unit change, the Class B segment lost the most ground. A little more than 30,000 net absorbed units to open 2021 was followed by roughly 9,000 net absorbed units in Q1 2022. The fact that Class A net absorption was more resilient than the other segments, with Q1 2022 actually bettering the same period in 2019 and 2020, is likely another indication of price pressure on apartment demand.
The Class D segment has seen less rent growth than the other price classes over the last year or more and residents may also benefit from other income supplementing programs. The Class B and Class C tiers are largely home to residents without access to those programs and have each seen double-digit rent growth over the last twelve months.
National Rent Growth
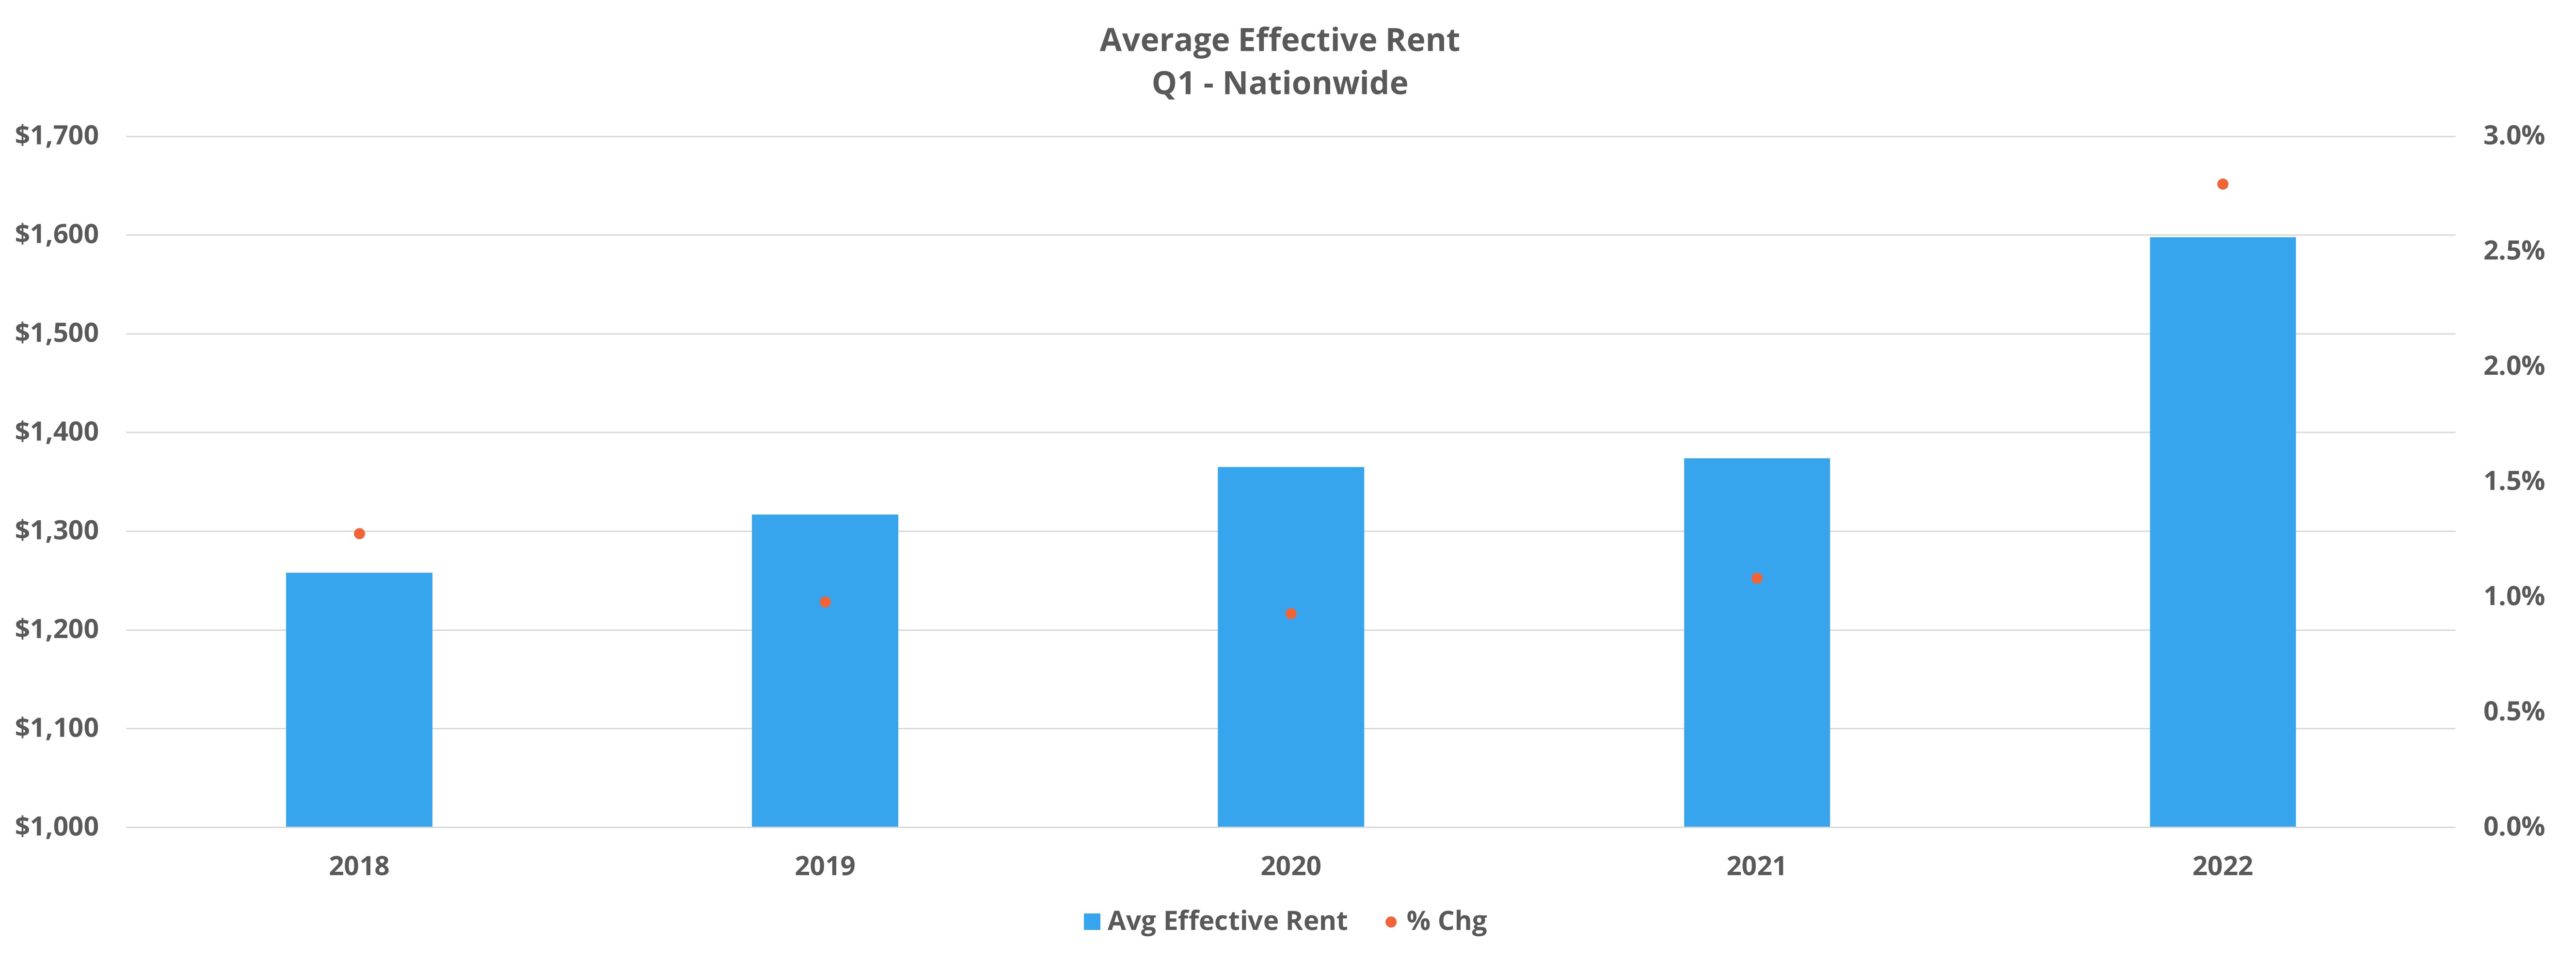
Despite the sea change on the demand side, average effective rent growth continued its torrid pace. A 2.8% gain in the first quarter for new leases was more than double the next highest gain of the last five years – a 1.3% increase in Q1 2018. From 2018 through 2021, the average quarterly change nationally was a gain of 1.1%.
Interestingly, markets of all sizes continued to see unusually high rent growth in the period. Of the four ALN market tiers based on multifamily stock in a market, none failed to reach at least 2% average effective rent growth. Secondary markets, a group that fared well in 2020 and followed that up with a strong 2021, led the way with growth in the quarter of a little more than 3%.


In our series Takeaways, ALN Apartment Data Senior Market Analyst, Jordan Brooks, shares more insight into the final thoughts on the April 2024 newsletter article…
From a price class perspective, Class A unsurprisingly led the way with a 3.3% increase in the quarter on average. This brought the average Class A unit to about $2,220 per month for new leases. The Class B subset was right behind with a 3% gain bringing the average unit to around $1,815 per month – nearly $300 more than 12 months ago. Class D was the only group to not exceed 2% appreciation in the quarter at 1.7%, while Class C added 2.5% appreciation.
Thanks to high average occupancies, even a downturn in apartment demand did not change the trajectory of lease concession movement to start 2022. Lease concession availability continued to decline during the first three months of the year and availability was already lower than in the months preceding the onset of the COVID-19 pandemic two years ago. Only 8% of conventional properties ended March offering a discount for new leases compared to 19% a year ago.
Markets of Note
17 markets around the country managed net absorption of at least 1,000 units in the quarter with familiar names like Dallas – Fort Worth and Houston in top five. Orlando, usually a top 10 market, found itself at number two overall behind DFW. There were also a couple of newcomers to the top five – Portland and San Francisco – Oakland. The Bay Area of California has been one of the slowest to come out of the COVID-induced doldrums, so its first quarter demand result was encouraging. On the flip side, Atlanta shed nearly 1,900 net leased units in the period.

Florida continued to dominate the list of top markets for rent growth in the first quarter with five of the top 10 markets being in the state. It should be noted however that only Orlando cracked the top 10 for apartment demand and it did not make the list for average effective rent growth. Fort Myers – Naples, Fort Lauderdale, and Palm Beach populated the top three markets.
Aside from just Florida, just about all of the top 10 markets for rent growth in the period were in the same region. Areas like Savannah, Myrtle Beach, Wilmington, and Knoxville were all in the top 10.
Takeaways
2021 was marked by exceptionally high apartment demand and rent growth, almost across the board in terms of different markets, price classes, the urban-suburban divide, et cetera. As the title of this month’s newsletter intimates, the first quarter of 2022 represented a shift in that dynamic. Rent growth remained very high across the board, but apartment demand was down significantly and equally ubiquitously.
As already mentioned, about 40% of US multifamily markets saw negative net absorption in the first quarter. As eviction moratorium regulations continue to pass further into the rearview mirror for almost all markets, one of the last artificial boons to average occupancy will exit stage left. If demand does not rebound through the typically strong second quarter, lease concessions will probably begin to make a comeback and could be followed by a deceleration in average asking rents as well.
Fundamentals remain strong for the industry, but the level of rent growth over the last 12 months has clearly begun to take a toll. And that is before any talk of continued runaway inflation, a possible recession in the next year, and the accompanying increase in unemployment that would occur.
Search, Analyze & Compare
ALN OnLine is a web portal that allows our clients to search properties, access submarket and markets trends, new construction, and more. Since 1991, we have continued to refine our business practices and methodology in order to offer our clients the absolute best in multifamily data.

Disclaimer: All content and information within this article is for informational purposes only. ALN Apartment Data makes no representation as to the accuracy or completeness of any information in this or any other article posted on this site or found by following any link on this site. The owner will not be held liable for any losses, injuries, or damages from the display or use of this information. All content and information in this article may be shared provided a link to the article or website is included in the shared content

