2025 Multifamily: Recovery Progressed but Remains Incomplete
2025 marked an inflection point for the U.S. multifamily industry, but not a clean return to equilibrium. After the extreme volatility of the immediate post-pandemic period, apartment demand had been rebuilding steadily in 2023 and 2024 before surging in 2025. At the same time, several key fundamentals finally began to realign. For the first time since 2021, net absorption outpaced new supply, and national occupancy posted its first annual improvement in four years.
Yet the recovery was incomplete. Rent growth slowed rather than accelerated, and lease concessions became even more prevalent. The result was a year that looked meaningfully better by some measures and more mixed by others – leaving room for differing interpretations of what 2025 ultimately represented for the industry.
View the full monthly Markets Stats PDF
New Supply Finally Eased
A major element of last year’s industry performance was the sharp realignment in the relationship between new supply and realized apartment demand. Relief emerged on both sides of the supply – demand equation, though the magnitude was far greater on the demand side.
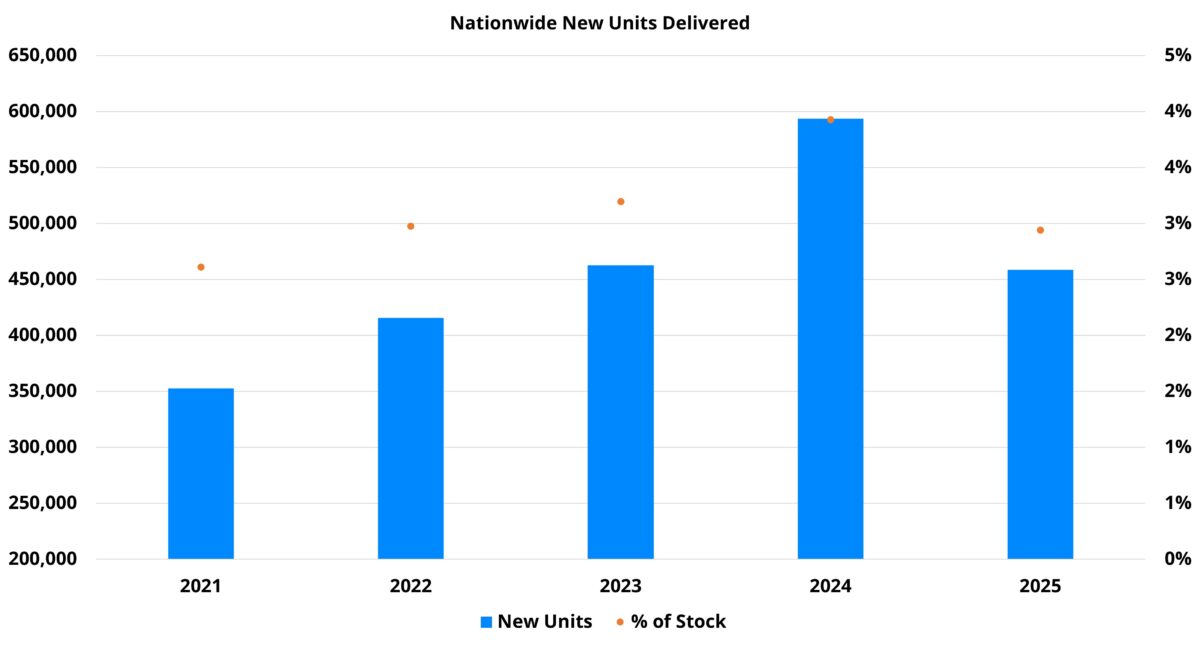
New supply was expected to decrease from its 2024 peak last year, and that occurred. About 460,000 new units were delivered nationally compared to nearly 600,000 new units in 2024. Last year’s new supply was the lowest since 2022 in aggregate units. When considering new deliveries as a share of existing stock – the 2025 value was the lowest since 2021.
Despite the decline, new supply continued to exert pressure on industry performance. This was due primarily to two factors: the sizeable backlog of deliveries from previous years that remained in lease-up, and that 460,000 new units still represented a large number for annual supply – especially relative to the pre-pandemic period.
Nevertheless, the annual decrease in deliveries was widespread. Rather than being a feature of only primary markets or only tertiary markets, a year-over-year decline was observed across market tiers when grouped as primary, secondary, tertiary, and micro.
The drawdown in new deliveries was a necessary development to realign the relationship between new supply and apartment demand, but would have been insufficient without improvement in demand.
Net Absorption Surged
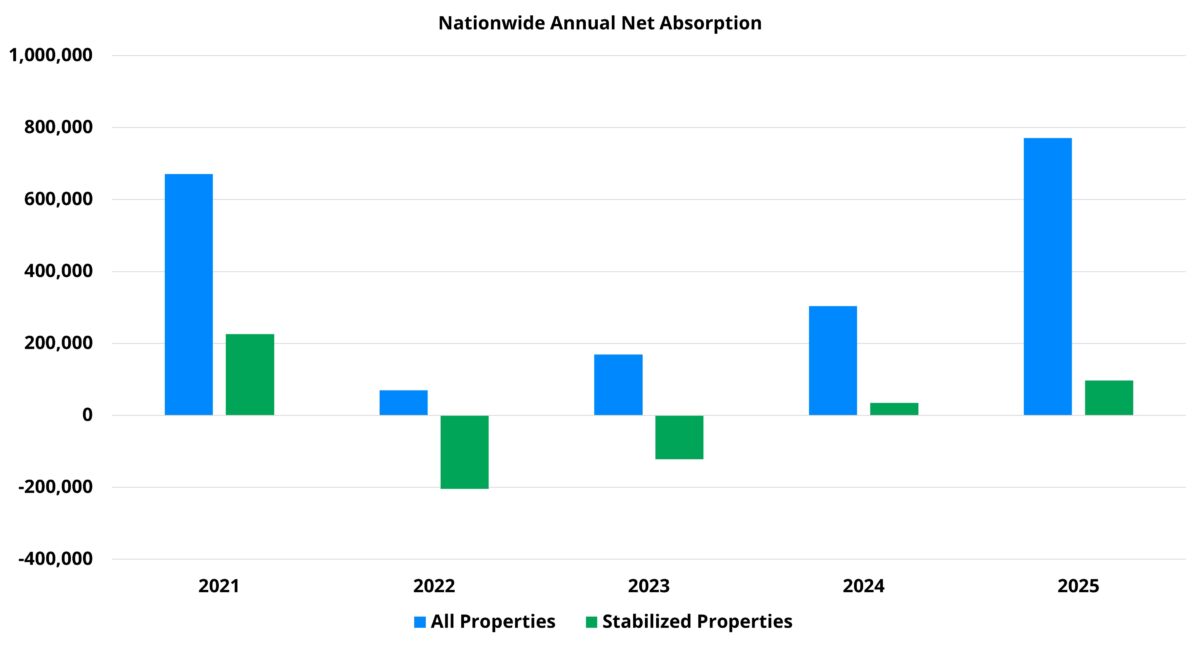
A reduction in new units was a welcome sight last year, but even more significant was the explosion in apartment demand that materialized. Coming into 2025, expectations were for a third consecutive year of annual net absorption improvement. However, the scale of the improvement was unexpected.
Approximately 770,000 net units were absorbed nationally last year. This more than doubled the total from 2024 and exceeded 2021 by 15%. 2025 marked the third instance in five years of a year-over-year doubling in net absorption. Unlike 2021 and 2023 – both of which followed years shaped by extraordinary conditions – last year’s surge came on top of a solid 2024 baseline.

Make 2026 the year that multifamily data works hard for you. Schedule a live demonstration with one of our experts to see how!
Single-family for-sale market is not as cleanly inversely correlated with apartment demand as is often assumed. Yet, its frozen state last year likely boosted multifamily net absorption by keeping some households renting that otherwise would have purchased. This is especially the case in markets with a higher share of homeownership and within the Class A multifamily space.
Persistently low national rent growth for three years, and negative rent growth in some markets, also played a role in boosting demand. So too did the proliferation of lease concessions and the sheer number of available units after years of feverish building.
An encouraging aspect of apartment demand last year was the widespread nature of the surge. Significant annual improvement occurred across price classes. The gains were most pronounced at the top of the market. Net absorption for the Class A and the Class B subsets topped 200,000 units each. This represented 12% of existing Class A stock and 7% of existing Class B stock.
Rent Growth Faltered
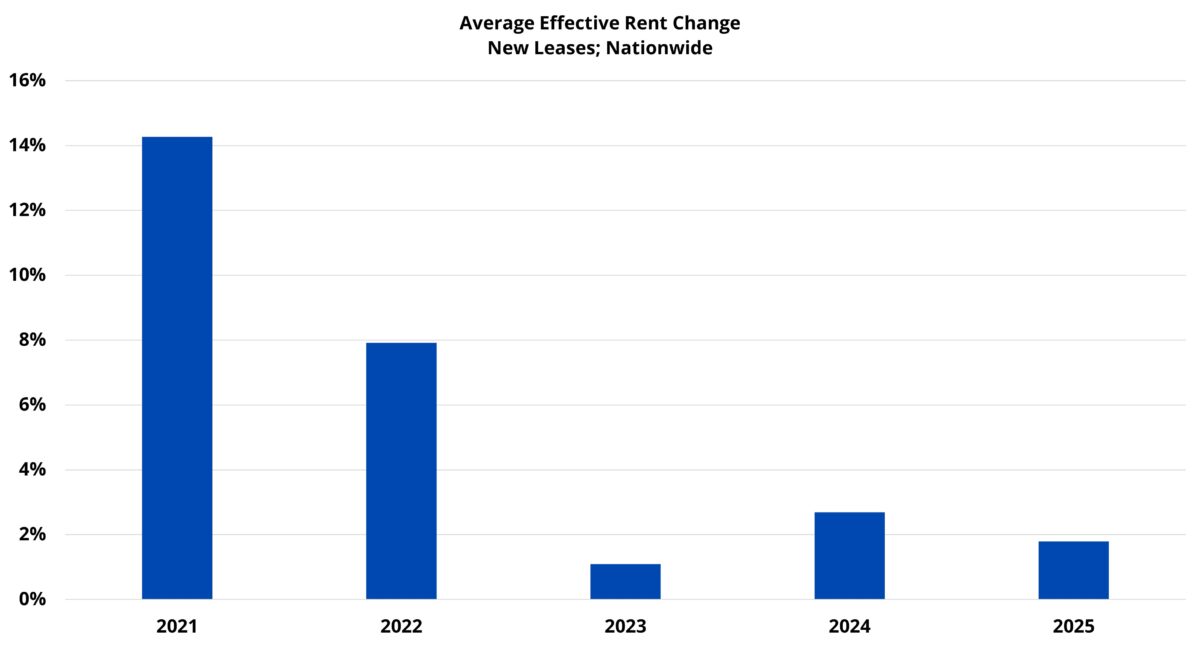
Despite a dramatic improvement in supply – demand dynamics, robust rent growth failed to materialize. In fact, an annual gain of 1.8% nationally in the average effective rent for new leases was less than the 2024 gain of 2.7%.
One reason for the underwhelming rent performance was that even with net absorption outpacing new deliveries by more than 300,000 units, national average occupancy finished the year at only 90%. This was after a 250-basis point annual gain.
The imbalance between copious new supply and inconsistent net absorption from 2022 through 2024 continued to impact multifamily performance last year – and will do so again this year. In addition to the new units that will come online in 2026, there were approximately 800,000 units in some phase of lease-up to begin the year.
Aside from unusually low occupancy which made it difficult for rent momentum to build, the lease concession environment was also a headwind. 23% of conventional properties were offering a discount for new residents at the end of last year – up 8% from the start of the year. This level of discount availability was the highest to end a year in more than a decade.
Affordability challenges likely continued to limit rent gains as well. Low rent growth and sustained inflation-adjusted wage gains in the 2023 through 2025 period have been helpful, but average effective rent remains well above its pre-pandemic level. Nationally, the difference stands at just more than $400 per month.
However, not all portions of the multifamily sector struggled to capture rent growth last year. Results were bifurcated by price class. A 4.8% average effective gain for the Class A segment more than doubled last year’s 2% appreciation. A 2.8% gain for the Class B group bettered last year’s total, but by a more modest margin.
A 0.7% gain for Class C was only about one-third of last year’s gain while the Class D segment suffered a 1.8% decline following last year’s 1.5% gain. The silver lining for the workforce housing portion of the industry was that the rent softening at least came alongside strong demand improvement.
Takeaways
2025 was not an unblemished success for the multifamily industry, but it was another important step in the right direction. New supply finally moderated and net absorption ended the year riding a three-year uptrend that gained major momentum.
Average occupancy, after sinking from 96% at its peak in 2021 all the way below 88% in 2024, finally began its vital turnaround. While further progress is needed, last year’s turnaround was arguably a bit ahead of schedule and 2026 presents a realistic opportunity for further gains.
On the negative side of the ledger, rent growth faltered after improvement in 2024. While not ideal, 2025 at least saw positive rent growth combined with excellent apartment demand.
A significant headwind for rent growth last year was growth in both the availability and average value of lease concessions. As mentioned in last month’s 2026 outlook, that same headwind has a chance to transform into a tailwind for rent momentum next year if apartment demand proves sustainable without the same reliance on lease concessions. The ultimate answer to that unknown will be a major driver of industry performance next year.
Note: All numbers refer to conventional properties of at least 50 units. Rent data reflect the rent for new leases.
Disclaimer: All content and information within this article is for informational purposes only. ALN Apartment Data makes no representation as to the accuracy or completeness of any information in this or any other article posted on this site or found by following any link on this site. The owner will not be held liable for any losses, injuries, or damages from the display or use of this information. All content and information in this article may be shared provided a link to the article or website is included in the shared content.