

January Multifamily Performance Was a Step in the Right Direction
National average effective rent and average occupancy both declined in January for a fifth consecutive month. This soft period has come as tepid apartment demand has been unable to keep pace with an active new construction pipeline. Seasonal trends, which were absent in 2020 and 2021, and began to reemerge in 2022, have also now returned in full force and have played a major role in recent months.
The spring period is when the multifamily industry usually sees apartment demand begin to conclude its winter hibernation. With spring rapidly approaching, now makes for an opportune time to evaluate how the winter period has played out.
All numbers will refer to conventional properties of at least 50 units and a time period from October through January.
View the full monthly Markets Stats PDF
National Apartment Demand
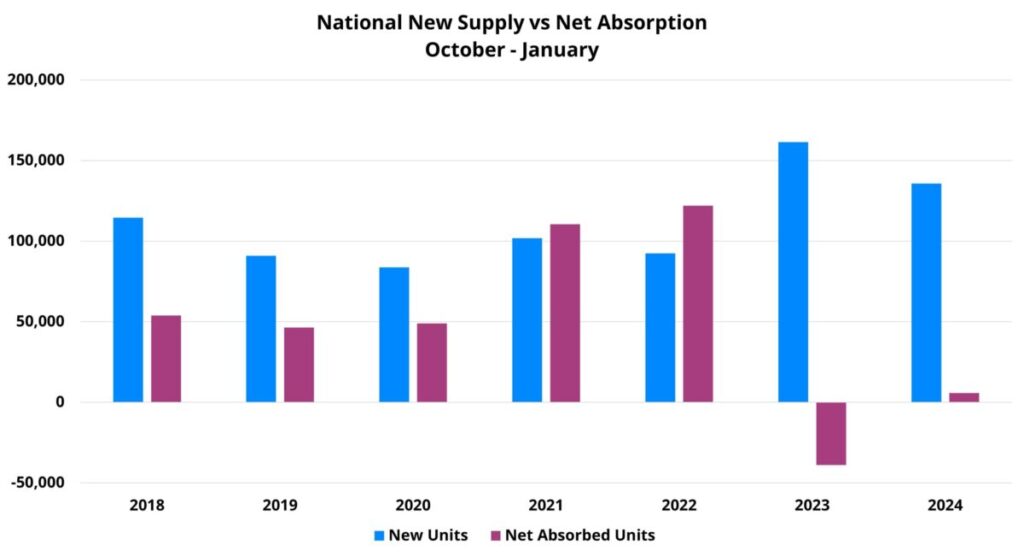
Apartment demand over the last four months has been significantly lower than is typically the case for even this weaker portion of the calendar. Setting aside the unusually high-variant last three years for a moment, the same four-month period ending in January in 2018, 2019, and 2020 had net absorption of approximately 50,000 units. By comparison, national net absorption totaled only around 6,000 units in the most recent four months. Despite the recent struggles, the subpar demand has been an improvement over last year’s net loss of about 39,000 leased units in the period.
The largest year-over-year improvement has come within larger markets and also outside of the top end of the market from a price class perspective. Primary markets have seen net absorption for this four-month period move from a net loss of about 26,000 leased units a year ago to a net gain of just more than 7,000 units this year. For secondary markets, the improvement was from a net loss of around 3,400 leased units from October 2022 through January 2023 to net absorption of about 3,000 units in the last four months.
Apartment demand improvement has also been more pronounced outside the price Class A subset. National Class B net absorption of nearly 9,000 units was more than double the total from the same period a year ago. For both Class C and Class D, the last four months have brought a further net loss of leased units, but the losses have been smaller than was the case last year. Class C moved from a loss of more than 21,000 net leased units to a net loss of just 4,500 units. For Class D, a decline of 25,000 net leased units has been followed by a net decline of only about 13,000 leased units.
Average Occupancy
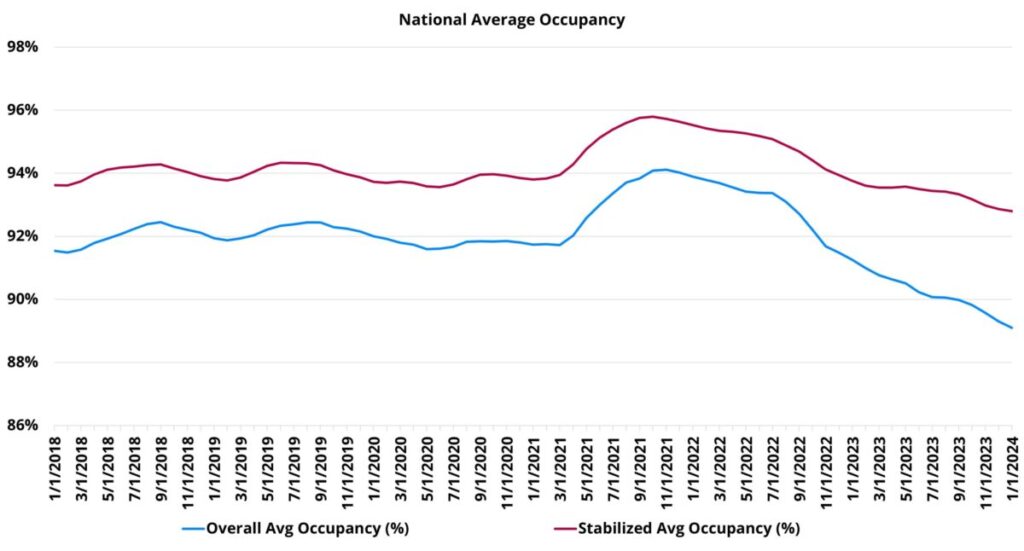
New supply from October through January totaled more than 135,000 units nationally. This was significantly higher than in any recent year except for last year when more than 160,000 new units were delivered in the same period. This moderate reduction in deliveries paired with improvement in net absorption resulted in a smaller decline in national overall average occupancy. Even so, a 90-basis point decrease brought the average to 89% to close January – the lowest average in years. For properties that entered the period already stabilized, average occupancy finished at 93%. The average occupancy for stabilized properties also concluded January lower than in any recent year but was much closer to the normal range than overall average occupancy.
Monthly average occupancy change improved slightly in January with a 0.2% decline relative to the 0.3% decreases in both November and December. This was thanks in large part to monthly net absorption returning to positive territory in January after having been underwater in November and December. New supply did not take a step back in January. About 38,000 new units were delivered nationally compared to the previous three-month average of around 33,000 units.
Despite all four price classes losing occupancy ground in recent months, each has seen improvement relative to the same period last year. Class A (-1.2%) and Class B (-1.1%), with most of the pressure from the new construction pipeline, saw the largest declines. Each closed January with the lowest average occupancy in more than five years, but the Class A average of just under 83% was only 50 basis points lower than at the same point in 2018. Without positive net absorption, but also without the torrent of new units, Class C and Class D average occupancy declined in the period by 0.7% and 0.8%, respectively.
Average Effective Rent
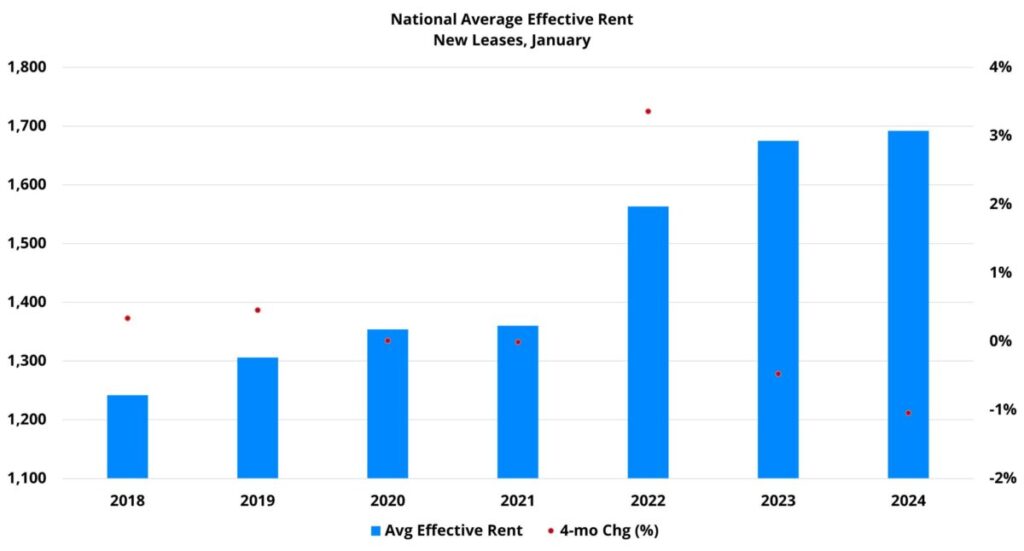
As with both net absorption and average occupancy, monthly average effective rent performance improved in January. A 0.1% decline nationally followed losses of 0.3% or 0.4% in each month in the fourth quarter of 2023. Taken as a whole, the last four months have seen the average effective rent for new leases decline by 1%.
As would be expected as the only two price tiers with positive apartment demand in the period, Class A and Class B properties have seen the smallest decline in average effective rent. For Class A, a 0.6% decrease was slightly better than during the same period a year ago. The same held true for Class B, as a 0.9% decline slightly bettered the 1.1% decline from the same portion of the calendar last year.
The inverse was the case for the bottom two price tiers. A loss of 1.2% at the average for Class C was an underperformance relative to the 0.8% decline last year. For Class D, a 1.9% decline followed just a 0.1% decrease last year. For each group of properties, the last four months were the worst for these months in more than five years.
Encouragingly, all four price classes saw month-over-month improvement in January. For the top two price tiers, January brought an end to the negative rent change – though, neither tier to managed to get above no change.
Similar to the negative move across the board by price class, rent growth has been negative over the last four months for primary, secondary, and tertiary markets when grouped as such. Only the micro market group managed to hold steady with no change in the period.
The challenge has been especially concentrated within primary markets. Secondary (-0.3%) and tertiary (-0.5%) have lost ground in recent months, but not to the degree of the 1.3% decline for primary markets. Growth markets across the Sunbelt region that have had sustained high levels of new supply have led the decline within the primary market group.
Takeaways
Multifamily performance during the winter season has provided both some positive and negative indications. On the positive side, apartment demand and average occupancy change have improved in the last four months relative to the same period a year ago. For the most part, the improvement has been widespread across the price classes and markets of different sizes. Monthly change in these metrics, as well as in average effective rent, has also trended in the right direction.
On the negative side, these same metrics remain well below their longer-term historical ranges even for this time of year. In particular, apartment demand remains unusually low, and 2024 deliveries will once again be over 400,000 units. This means that an overall average occupancy nationally that is already sub-90% will all but certainly be pressured further downward this year.
In an environment with improved but still low demand, high supply, low average occupancy, and external economic and geopolitical headwinds – it is hard to envision a scenario in which rent growth makes significant strides this year. With the caveat that there are many exogenous possibilities that could shake everything up, 2024 may well shape up to be another modest step toward normalcy after the first such step in 2023.
Get the data you need to make the right decisions. Learn more about our data, methodology, and platforms to see why thousands of multifamily professionals rely on ALN Apartment Data every day!
Strengthen Your Multifamily Strategy
Get the data you need to make the right decisions. Learn more about our data, methodology, and platforms to see why thousands of multifamily professionals rely on ALN Apartment Data every day!
Disclaimer: All content and information within this article is for informational purposes only. ALN Apartment Data makes no representation as to the accuracy or completeness of any information in this or any other article posted on this site or found by following any link on this site. The owner will not be held liable for any losses, injuries, or damages from the display or use of this information. All content and information in this article may be shared provided a link to the article or website is included in the shared content.