Q3 2019 Multifamily Review
Summer is in the rearview mirror; the holiday season is approaching, and another quarter is in the books. Nationally, the new construction pipeline delivered more units in the third quarter of this year than the same period in 2018 or in 2017. Demand in the quarter was strong, and the result was essentially no movement in average occupancy, while average effective rent rose 1%.
All numbers will refer to conventional properties with more than 50 units. Just like our first quarter review, we’ll go by National Apartment Association (NAA) regions and identify some high and low points from each.
Jump to a section
View the full monthly Markets Stats PDF
Region 1—Washington DC, MD, PA, VA, WV
The DC metro area led this group in new supply, with over 4,300 new units in the quarter. The only other area to deliver more than 1,000 units was Philadelphia, the location of about 1,200 new units.
Net absorption* for Region 1 was mostly driven by the 2,900 absorbed units in Washington DC, about 2,000 newly rented units in the Philadelphia area and the nearly 900 absorbed units in the Norfolk area. Baltimore gained about 800 newly occupied units and Richmond absorbed a little over 700 units. No market in this group finished November below 93% for average occupancy.
The larger markets, like DC, Baltimore, Philadelphia and Pittsburgh each managed to add 1% to average effective rent in the period. Areas such as Norfolk and Roanoke also join that list, with Roanoke leading all markets at 1.9% growth. In terms of monthly rent, DC continues to lead the way at about $1,830 per month.
Region 2—CT, MA, ME, NH, NY, RI
Unsurprisingly, most of the new construction activity in Region 2 was in the Boston and New York City markets, adding about 3,200 units and about 1,100 units respectively in Q3.
Demand for these markets was similarly skewed toward Boston and NYC, however, Boston failed to absorb more units than were introduced for the period. This led to a 75-basis point drop in average occupancy to just above 92%. New York saw the number of rented units rise by about 6,000 units, easily outpacing the roughly 1,100 new ones that entered the market. The effect was a 1% average occupancy gain to nearly 93%. The Augusta – Portland region of Maine suffered a 5.5% decline in average occupancy but remains above 92% occupied.
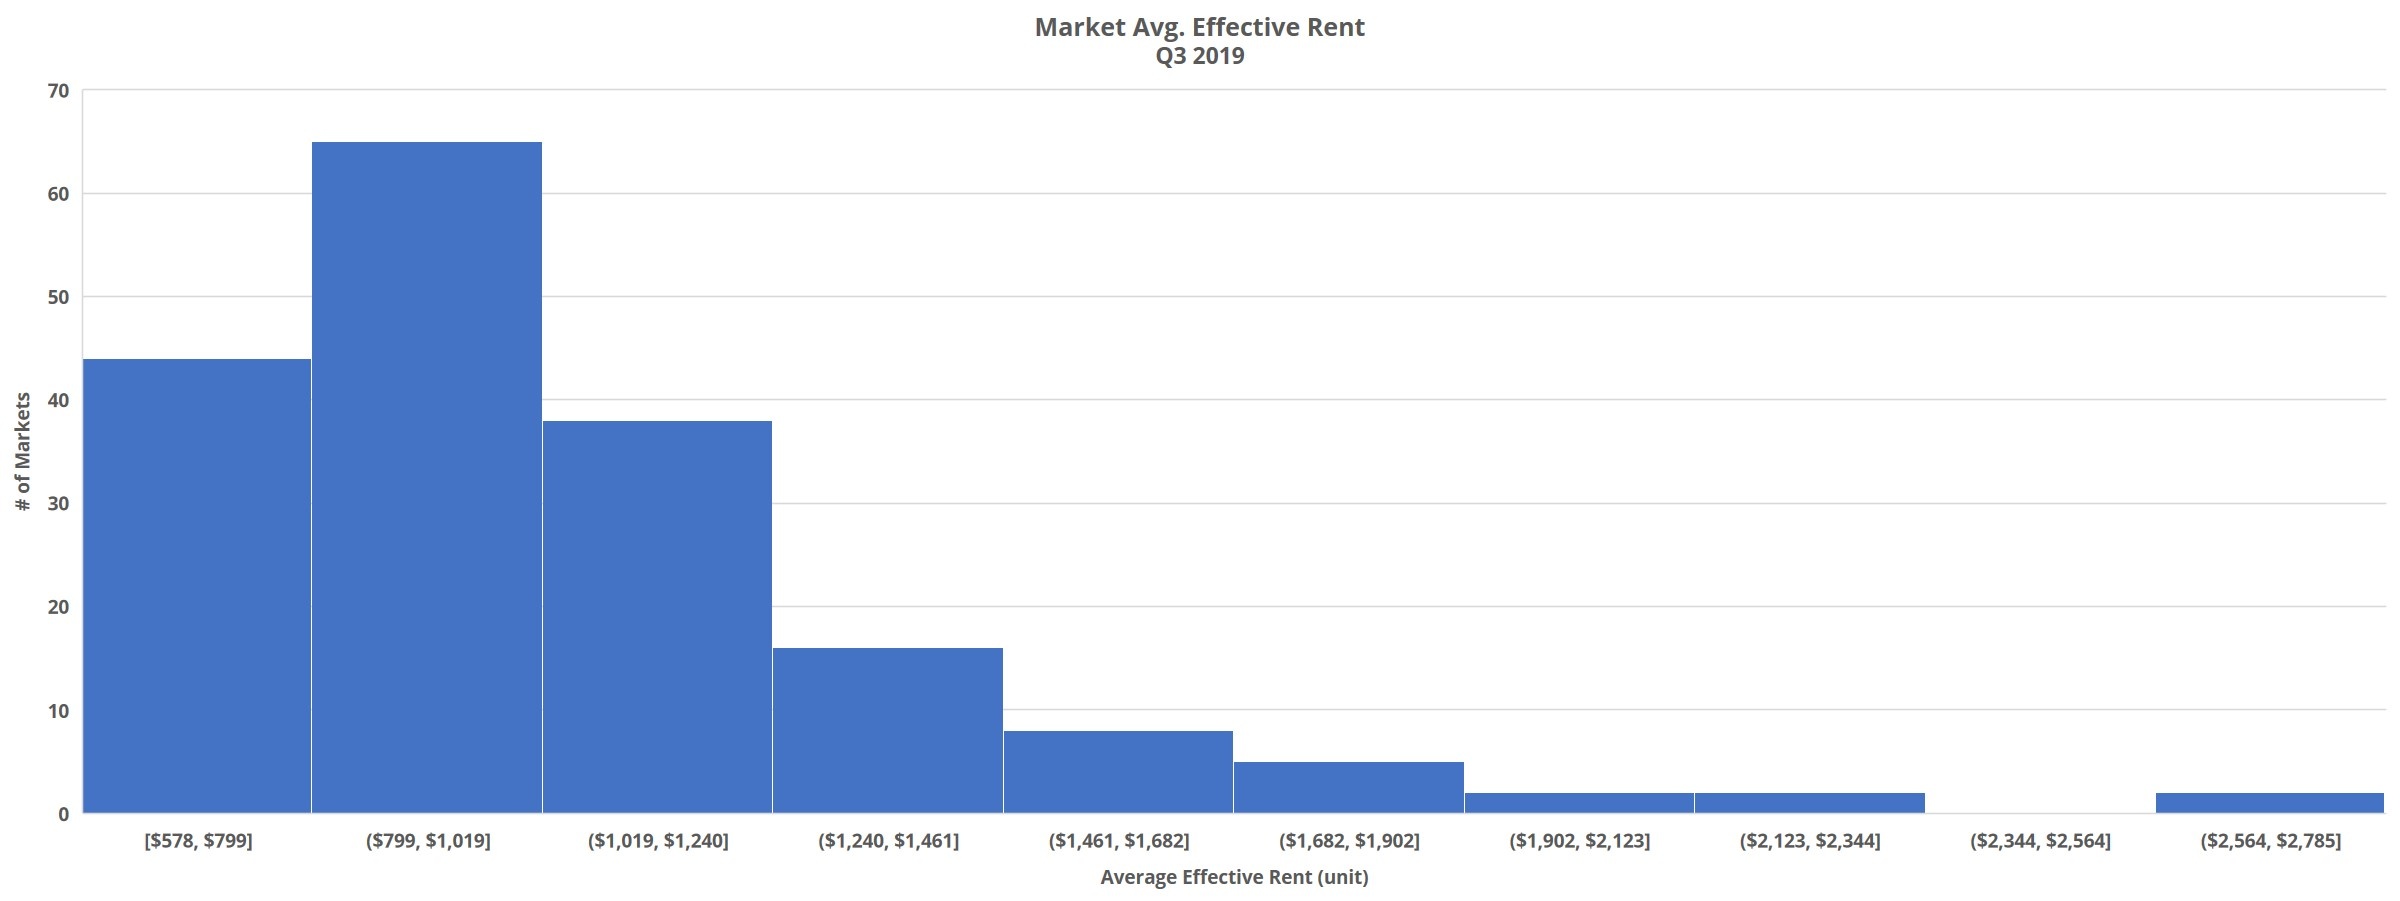
Average effective rent growth was strongest in the Concord market, where a nearly 4% gain led to the average rent ending September at $1,330 per month. The other big movers were the Springfield and Boston markets, adding about 1.9% and 1.5% in average rent respectively. NYC continues to pace this region in average rent, ending Q3 at $2,650 per month.
Region 3 – IL, IN, MI, MN, OH, WI
The Chicago market added 2,800 new units in the quarter. The only other market in Region 3 to deliver more than 500 new units in the period was Columbus, with 625 new units. Areas such as Detroit, Minneapolis – St. Paul and Grand Rapids – Kalamazoo – Battle Creek each introduced a little more than 400 new units.
Despite Chicago absorption nearly reaching 3,000 units, average occupancy fell by about 20 basis points to finish September a hair under 90%. Every other market finished the quarter above 92% average occupancy, with nine of the 17 markets in this region finishing at 94.5% or better. Demand was also strong in Columbus where almost 2,500 units were newly rented. The Cleveland – Akron area, the only other market to absorb more than 1,000 units in the quarter, managed more than 1,200 newly rented units. On the other side of the coin, Milwaukee suffered a 50-basis point loss in average occupancy after the number of rented units fell by 3,000.
Effective rent gains were somewhat more tepid in this region, as only three markets exceeded the national average gain of 1%. Detroit and Minneapolis – St. Paul both gained about 1.3%, while Cincinnati – Dayton led the way with average rent appreciation of 1.4%. Evansville and Toledo each regressed by approximately 1%. As of the end of September, Chicago remains the most expensive market in Region 3 with an average effective rent of around $1,600 per month.
Region 4 – GA, KY, NC, SC, TN
The Raleigh – Durham market added about 1,100 new units in the third quarter, surpassed in Region 4 only by the nearly 2,600 new units in Atlanta. Smaller markets like Lexington, Greenville – Spartanburg and Myrtle Beach each introduced a little more than 300 units.
Demand in the markets with the most new construction activity was more than enough to outweigh the new supply. Atlanta absorbed almost 3,900 units in the quarter and Raleigh – Durham had 2,500 newly rented units. Charleston gained almost 1,000 newly rented units and Greenville – Spartanburg managed more than 700 units.
A few of the markets without any new units took advantage and saw average occupancy rise. Albany added nearly 4% to average occupancy to finish September at 95%. Knoxville gained 2% to end at almost 94% and Columbia average occupancy rose by 1.4% to a little above 93%.
Average effective rent in this region was solid comparted to the nation overall. Both Atlanta and Augusta managed 1.5% growth, while Albany and Chattanooga hit 1.4%. Raleigh – Durham paced the field at 1.6% average effective rent growth.

Region 5 – IA, KS, MO, NE, OK
Most of the markets in Region 5 delivered no new units in the quarter. Kansas City added a little more than 1,100 new units, and St. Louis added almost 1,400. The only other area to introduce any new construction units was Tulsa, with about 250 new units.
Despite the relative lack of new construction activity, there wasn’t much positive movement in average occupies for most of these markets. Des Moines led the way with an almost 2% occupancy gain to finish the period at just above 93%. Omaha ended September at nearly 92% occupancy thanks to a 70-basis point improvement and the Topeka – Manhattan – Lawrence region gained 60 basis points to hit 91% average occupancy.
Wichita and St. Louis each suffered occupancy retractions of about 40-basis points, Oklahoma City is the only market in these states to end the quarter below 90% average occupancy, finishing at 89%.
Effective rent change was a bit of a mixed bag in this group. Five of the 11 markets surpassed the national average of 1%, but three markets saw average effective rent decline. Columbia led the way in growth, at 1.4% in the quarter. Wichita added 1.3% to the average rent and Tulsa managed appreciation of 1.2%.
On the negative side, Springfield lost about 60 basis points at the average, as did the Topeka – Manhattan – Lawrence area. Lincoln also lost ground, but by less than 10 basis points. Kansas City remains the priciest market, with the average rent per unit sitting at about $1,115 per month.
Did you know? “2019 Q1 Multifamily Review” was our most popular article this year!
Region 6 – AR, NM, TX
Region 6 has the most variance between markets for rent growth of any region we’ve looked at so far. On the high end, Little Rock average effective rent rose by 2.6% in the period and the Northwest Arkansas and Corpus Christi areas gained 2.2% each. Austin was the other market to hit 2% growth, at 2.1%. On the low end, Midland – Odessa average rent retracted by a little more than 3%. Longview – Tyler lost 60 basis points and average rent in Lubbock declined by about 60 basis points.
The smaller Texas markets performed well. Average rent in El Paso and in Victoria rose by 1.5%, the Waco – Temple – Killeen region added 1.6% and San Angelo gained 1.8%.
Almost all of the new construction units for Region 6 were delivered in Austin, Dallas – Fort Worth and Houston. Austin added about 2,500 new units, Houston added about 3,200 units and Dallas – Fort Worth introduced 5,600 units in the quarter. Even with this volume, all three markets managed slight average occupancy improvements. Austin added close to 20 basis points to end the 3rd quarter at just under 92%. Houston gained around 7 basis points, staying around 90% and Dallas – Fort Worth gained 25 basis points to finish at a little above 91%.
Demand was strongest in DFW, where nearly 7,000 units were newly rented from July through September, easily outpacing the new supply. Houston absorbed 3,500 units and Austin about 2,900 units. Both Little Rock and Albuquerque lost rented units, 125 and 270 respectively. The only other major mover was San Antonio, where 2,100 units were newly rented.
Region 7 – AK, AZ, ID, NV, OR, WA
Six of the eleven markets in Region 7 experienced effective rent gains above the national average. Tucson led the way, with rents climbing 2.5%. Another strong performer was the Boise area, where average effective rent rose almost 2.4% and Phoenix topped 2.2% growth in the period.
There were a couple of less sterling results as well. Flagstaff average rent fell by 1.3%. Areas like SE Washington, Anchorage and Seattle only managed about 30-basis point gains each. Unsurprisingly, Seattle is by far the most expensive market in the region, with average effective rent hitting $1,800 per unit to end September.
New supply was concentrated almost exclusively in the three largest markets in these states. Phoenix added about 2,000 new units. 800 new units were delivered in Portland, and in Seattle, about 2,700 new units were brought online. While absorption was similarly concentrated in these markets, unlike Region 6, no markets suffered a net loss in rented units for the quarter.
Areas like Anchorage, Tucson and SE Washington saw almost no change in the number of rented units but did gain a few each. Portland added nearly 1,700 units to the pool of rented units and Seattle absorbed 3,000 units. Tucson absorbed about 2,200 units and the smaller markets like Boise and Reno came in at just below 500 units absorbed.
Region 8 – CO, ND, SD, UT
Rent growth in Region 8 was tepid, to say the least. Only Rapid City beat the national average of 1% rent growth in the quarter, coming in at 1.2%. Salt Lake City rents rose by about 80 basis points and the Denver – Colorado Springs region was the only other market to add even 50 basis points to average rent. In Sioux Falls, rents retracted by 1.5%.
Only Denver – Colorado Springs and Salt Lake City had any new supply, with about 2,000 and 2,400 new units delivered respectively. Fargo and Sioux Falls in particular took advantage of no new supply. In Fargo, average occupancy rose by almost 5% to end September at more than 95%. Sioux Falls gained nearly 2.5% in average occupancy, bringing the area back above 90%. Bismarck realized an occupancy improvement of about 75 basis points, adding to an already high average to finish just under 96%. Only Salt Lake City experienced an occupancy loss, with a regression of more than 1.5% to end the third quarter just below 91%.
Net absorption in the Denver – Colorado market topped 3,300 units. Fargo and Salt Lake City were the other markets to approach 1,000 units absorbed, both with around 800 newly rented units.

Region 9 – AL, FL, LA, MS
Region 9 is another region with muddled rent growth performance. Of the 23 ALN markets in these four states, seven beat the national average, five lost ground and the remaining dozen were somewhere in the middle. The positive results were in areas such as Huntsville, Montgomery, Palm Beach and Gulfport – Biloxi.
Average effective rent rose by 1.8% in Huntsville, 1.7% in Montgomery, 1.4% in Palm Beach and 1.3% in Gulfport – Biloxi. Lake Charles suffered the largest average rent decline, losing 4.5%. Melbourne, Miami and Shreveport all also saw average rent retract in the quarter, though each by less than 1%.
New supply was a bit more widely distributed compared to the last few regions covered. Tampa added about 2,200 new units. Miami and Orlando each delivered around 1,500 new units. Jacksonville was the other market with at least 1,000 new units in the quarter after bringing a little more than 1,100 to market. In the smaller markets, Mobile added more than 400 new units, Fort Myers – Naples added 800 units and Palm Beach introduced about 400 new units.
About one third of the markets in these states saw an overall decline in the number of rented units from July through September. Mobile, Gainesville, Pensacola, Lake Charles, New Orleans, Gulfport – Biloxi and Jackson – Central MS are all in this category, led by the 230-unit decrease in Jackson – Central MS. On the positive side, both Tampa and Orlando absorbed almost 2,000 units in the quarter and both Jacksonville and Miami topped 1,000 units absorbed.
Region 10 – CA, HI
It shouldn’t surprise anyone that almost every market in Region 10 surpassed the national average in quarterly rent growth. Average effective rent in the San Joaquin Valley area rose by 1.9%. Los Angeles – OC, Sacramento, San Bernardino – Riverside and San Diego all saw appreciation of about 1.4%. Only Honolulu lost ground in terms of rents, with a decline of 2%.
The Bay Area continues to be the most expensive market in the region, with the average unit leasing for $2,800 per month. The Central Coast region of California and San Diego are each only a few dollars away from the $2,000 average monthly rent mark. The LA – Orange County market is the other to have already crossed this threshold, and finished September at $2,200 per month.
About 4,300 new units were added in the LA – Orange County area, followed by 3,200 new units in the Bay Area and 1,800 new units in San Diego. Honolulu was the only market with no new supply in the quarter. Net absorption was not exactly robust across the region, especially when comparing the new supply in the largest markets to their net absorption.
The Los Angeles – Orange County market, absorbed only 1,600 units in a quarter in which it added 4,300 new units. Similarly, San Diego added almost 1,300 units to the rented category, a full 500 units short of the new supply volume.
The result of the somewhat lackluster demand numbers was a negative value for average occupancy change for the region overall. The LA area lost about 60 basis points in average occupancy, as did the San Joaquin Valley and San Diego. The Bay Area average occupancy declined by 1.2% and the 1.3% gain in Honolulu was the only gain in the region outside of a 9-basis point improvement in Sacramento.
Q3 2019 Takeaways
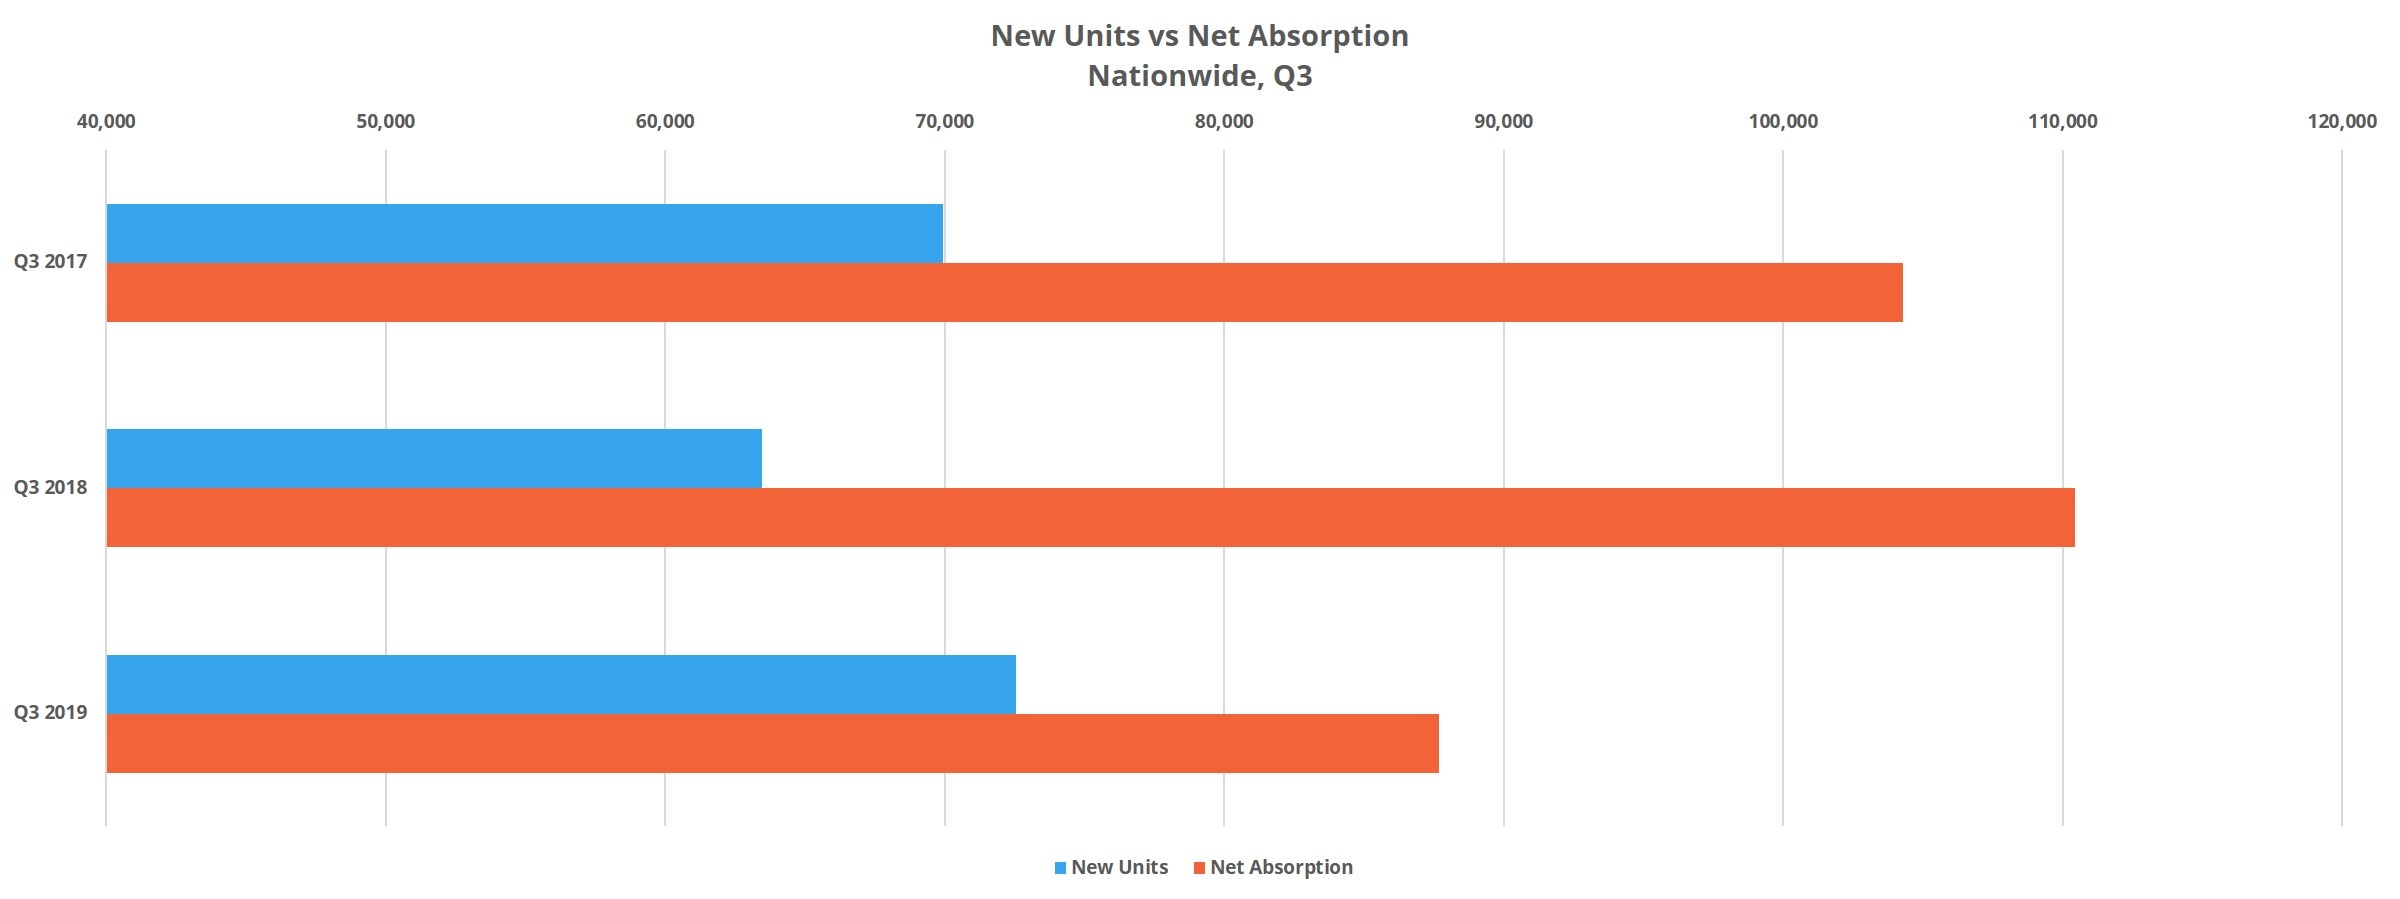
On a national scale, the third quarter was one in which there was a high volume of new supply, a solid but unspectacular 1% average effective rent gain and flat average occupancy. The more than 72,000 new units in the quarter is more than was delivered in Q3 2018 or Q3 2017. At the same time, net absorption was about 20,000 units short of the mark hit in those previous two third quarters.
The result of the comparably subdued demand and increased supply was a stalemate in average occupancy. Flat quarterly occupancy growth is less than ideal, but occupancy change has been less than 50 basis points for three straight third quarters now as the construction pipeline has continued unabated. Quarterly rent growth of 1% is well short of the gaudy gains from a handful of years ago but is also right in the middle of the range from the last three years for Q3.
Overall, the trend of steady average occupancy and flattening rent growth is continuing. There aren’t many markets showing serious signs of overbuild yet, but the construction pipeline also isn’t slowing. These new units will continue to pressure occupancy and rent growth, so the industry doesn’t have much cushion should economic conditions deteriorate.
*Net absorption refers to the net number of newly rented units in a period
Disclaimer: All content and information within this article is for informational purposes only. ALN Apartment Data, Inc. makes no representation as to the accuracy or completeness of any information in this or any other article posted on this site or found by following any link on this site. The owner will not be held liable for any losses, injuries, or damages from the display or use of this information. All content and information in this article may be shared provided a link to the article or website is included in the shared content.

