

Nationally in 2017, the multifamily sector added more than a quarter of a million conventional units to the market. Fortunately, absorption outpaced the growth by nearly 30,000 units and national average occupancy rose 0.4% to 91.7%. Occupancy, however, did get up to 92% by the end of the Q3. The influx of units at the end of the year outpaced the absorption in the final quarter.
The story is much the same for rents in 2017: almost all the growth was in the first three quarters. While effective rents grew in the 7% range nationally through the first nine months of the year, the last quarter saw flattening or decreasing rents. Currently the average apartment unit in a conventional property effectively rents for $1,247 per unit and $1.39 per square foot.
View the full monthly Markets Stats PDF
For most of the country, the first 3 quarters of 2017 were mostly positive across the board. Q4, however, brought a regression and both rents and occupancy flattened or declined. The high plains states saw the opposite with Q4 bringing welcome relief to lackluster performance in the first three quarters. Florida stands out in a good way from the trend with almost universal solid performances across the board.
Washington/Oregon
Seattle found itself among the strong performers nationwide and saw rents rise in the 10% range in 2017 to an average of $1,640 per unit. However, like the national trend, nearly all of the growth occurred in the first half of the year. Portland, currently at $1,303 per unit, had more modest gains for the year.
Effective rents rose only 2.6% over the last 12 months in the northwestern Oregon market. Spokane actually had negative rent growth for the year and average effective monthly rent is down $24 per unit from the beginning of the year to $936. Despite a lackluster 4th quarter with a gain of less than 500 net rented units, Seattle absorbed more than 8,000 conventional units in 2017; an increase of more than 50% from the prior year.
Relatively speaking, in terms of occupancy, Portland fared much better over the last 12 months. The market absorbed more than 5,000 net rented units in 2017 and the 4th quarter of the year accounted for nearly half of those rentals. Consequently, occupancy in the Portland area rose 0.7% in Q4 2017 to a healthy 92.8%.
California
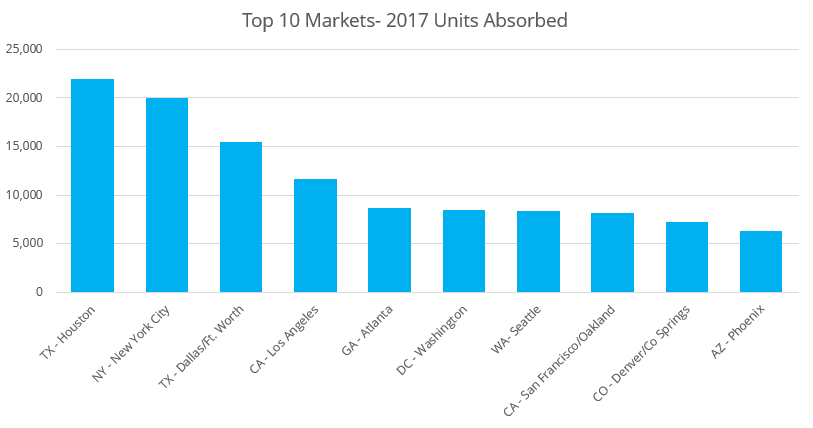
The California markets managed to absorb more than 22,000 net conventional units in 2017. The vast majority of the units were absorbed within two markets: The Bay Area and the greater Los Angeles area. The Bay area absorbed more than 8,000 units in the last 12 months and 4,000 of those units were absorbed in the 4th quarter alone. However, new construction continued unabated throughout the year. While occupancy is up 1.2% for the year in the Bay Area, average occupancy only grew 0.1% in the 4th quarter.
Los Angeles experienced much the same situation. The market absorbed over 11,000 units in 2017 with just under 4,000 of those units absorbed in Q4 2017. However, average occupancy, while up 0.8% from a year ago, grew only 0.1% in Q4. The two large California markets lagged a bit behind the other California markets in rent gains for 2017. Both Los Angeles and the Bay Area had effective rent gains in the 4% range while the other markets like Sacramento, San Bernardino and the San Joaquin Valley saw gains in the 6-8% range.
Arizona/Nevada/New Mexico
The desert region markets mostly kept pace with the national average for effective rent growth in 2017. Las Vegas, Tucson and Phoenix all realized gains of about 7% for the year, and saw slowing – but positive – growth through the 4th quarter. The other smaller markets in this region, however, all gave back effective rent gains in the 4th quarter. Losses ranged from 0.8% in Flagstaff to 1.4% in Reno.
New construction is still producing slight pressure on average occupancy for these markets. Phoenix absorbed over 6,000 units in 2017, and Las Vegas clocked in at just above 2,000 units. Both markets did fairly well by absorbing nearly all of the new units brought online without slashing prices.
The smaller markets such as Albuquerque and Reno, though, experienced negative absorption for 2017. Average occupancy gains were modest at best, with Tucson outpacing the other markets in this region at about 1% annual growth. The good news for all these markets is that average occupancy is still healthy in the 92-94% range.
Idaho/Utah/Montana/Wyoming/Colorado
Denver added more than 6,000 units to the market in 2017, and fortunately absorbed more than 7,000 to bring average occupancy up 0.7% for the year to 90.8%. Some gains were given back in the 4th quarter, though, as the market experienced negative absorption of a few hundred units.
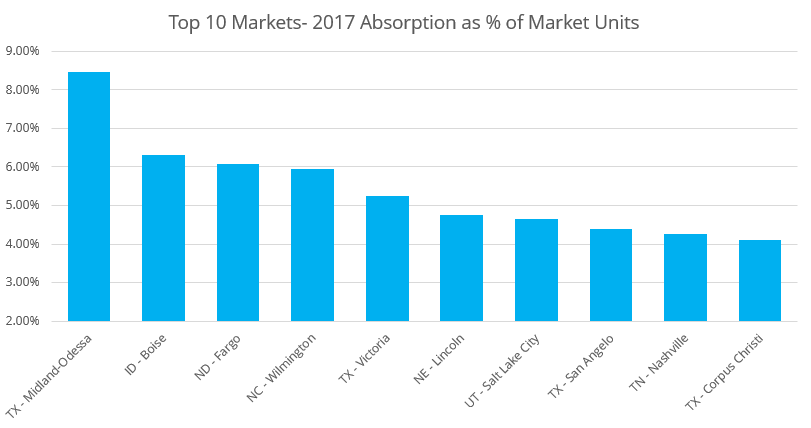
Salt Lake City also performed well in 2017. The market absorbed over 3,200 net rented units while adding 2,400 new units to the region. Consequently, occupancy jumped 1.6% to 92.5% over the last 12 months. Wyoming absorbed a few hundred units over the year, yet Montana had basically flat absorption. Both Denver and Salt Lake City saw effective rents rise about 5% for the year, though in Denver rents decreased in the final quarter if the year.
North Dakota/South Dakota/Nebraska/Iowa/Kansas
Fargo absorbed about 1,000 units in 2017, followed by Lincoln at almost 700 units and Des Moines at 500 units. These markets accounted for nearly all absorption in 2017 for these five states, each outpacing the introduction of new units. On the other hand, Wichita and Sioux Falls both experienced slightly negative absorption for the year and saw occupancy fall to 91.1% and 83.6%, respectively.
This region fell below the national average of 7% annual average effective rent growth. The brightest points were Fargo, with an annual increase of 4.5%, and Sioux Falls, with an increase of 3.5% in 2017. Bismarck experienced a decline in average effective rent close to 10% for the year, with most of the slide coming prior to the 4th quarter of 2017. Rapid City was another market to have negative effective rent gains for the year, a decline of just under 6%.
Across most of the markets in this region with negative effective rent growth for the year, the 4th quarter offered a bit of a reprieve, as the losses actually slowed. Conversely, Des Moines average effective rent declined just over 1% in the 4th quarter of the year, which was enough to put the market negative for 2017- albeit just less than 1% negative.
Oklahoma/Louisiana/Arkansas/Missouri
Arkansas added just over 1,500 units in 2017, and absorbed just under 1,000. Occupancy declined slightly in Little Rock by just under 0.5% – mostly because a majority of the new units were delivered elsewhere in the state. This resulted in a decline of 1.1% in occupancy in the Northwest Arkansas region.
Louisiana had negative absorption for the year, fueled almost entirely by Baton Rouge, which saw a negative absorption of over 1,000 units. Also contributing to the average occupancy decline was the fact that nearly 900 new units were added to the market during the year, and there was no slowdown in the 4th quarter. In fact, no Louisiana market that saw an introduction of new units could absorb them all. Shreveport and Monroe stand as the only markets in the state to see an occupancy gain- at 1.3% and 1% respectively – due to a lack of new unit deliveries.
Missouri fared better in 2017. Kansas City added over 2,100 units and absorbed nearly 2,500. St. Louis added just under 900 units and nearly absorbed them all, while only Columbia saw negative annual absorption of just under 100 units. Oklahoma City delivered over 1,200 units while absorbing less than 300, resulting in a drop in occupancy of over 1% to 87.9%. For the most part, rents grew at a slower pace in this region than the country overall- with a couple of exceptions.
Average effective rents rose more than 15% in Monroe without the introduction of new units, and Springfield saw gains of 9% in 2017. On the other end of the spectrum, average effective rents in Lake Charles declined 7.5% per unit, with nearly half of that decline coming in Q4. Louisiana was the only state in this region to have markets with negative effective rent gains in 2017. Arkansas, Missouri and Oklahoma markets all saw gains in the 1-3% range apart from the aforementioned Springfield.
Texas
The Dallas-Fort Worth and Houston metroplexes accounted for 72% of the units absorbed in the state for 2017, despite accounting for only 67% of the tracked units in Texas. DFW maintained a flat occupancy of just under 91% for the year even as over 15,000 new units were introduced.
Even with the difficulties due to Harvey, Houston added over 10,000 new units. The forced reallocation of residents due to damages contributed to the absorption of over 20,000 units for the year, while seeing occupancy rise more than 2% to 89.6%. In fact, more than 13,000 units were taken offline due to Hurricane Harvey in the Houston market – by far the most of any natural disaster affected areas of the country since the New Orleans area was devastated by Katrina in 2005. As a comparison, the entire state of Florida lost less than 1,000 units due to Hurricane Rita.
Austin and San Antonio each absorbed about 6,000 and 4,500 units respectively during the year, with average occupancy ending the year right around 90% for both. Many of the secondary and tertiary markets like Amarillo, Lubbock, Lufkin and Wichita Falls lost ground from an absorption perspective, and occupancy declined annually in many of the small markets by 3-6%.
Q4 was particularly problematic for markets like Amarillo, Beaumont, and Texarkana- each suffering significant occupancy losses in the final quarter. Even with the delivery of over 7,000 new class A units in Austin for the year, average effective rent per unit declined by 0.6%, a result of a Q4 decline of 1.5%. Average effective rent rose in Dallas-Fort Worth by about 4.5%, 5% in Houston and 3% in San Antonio for the year.
Minnesota/Wisconsin/Illinois
Most major markets in this region displayed signs of overbuild in 2017. Chicago absorbed less than 3,500 units while net units rose by more than 6,500. Similarly, Madison had negative absorption while delivering nearly 1,500 new units and Milwaukee absorbed less than half of about 2,100 newly added units in 2017. Minneapolis-St. Paul stands alone as a large market in this region to experience occupancy gains – to the tune of 1.7% – after introducing just under 2,000 units and absorbing close to 5,000.
The good news is average effective rents did not suffer similar declines for these larger markets. In fact, Springfield is the only market in these states to see a decline in average effective rent, at a rate of just over 1%. Average effective rent per unit rose more than 4% in Chicago, 4.5% in Minneapolis-St. Paul, 4.5% in Madison and 6.6% in Milwaukee.
Michigan/Ohio/Indiana
Columbus, Detroit and Toledo were the only markets in these states to see average occupancy gains in during the year, and by the slimmest of margins. Detroit added over 1,000 units and absorbed over 1,300 – resulting in an occupancy gain of only 0.1%. Of note, however, is the fact that almost all new units for the year were delivered in Q4, which resulted in a pullback in both occupancy and net absorption.
Columbus added nearly 2,000 new units and absorbed just under 2,200 – moving average occupancy up by 0.3% to 93.5% for 2017. The largest occupancy gain for this region was Toledo. Absorption nearly doubled the delivery of new units and average occupancy rose to 95.2% for an annual gain of 1.4%. Of the remaining markets, only Fort Wayne, at -1.6%, suffered an occupancy loss of more than 1%.
Despite a mixed bag regarding absorption and average occupancy, average effective rent per unit rose in almost every market both for 2017 overall, and Q4 alone. The lone exception being Evansville, with a marginal decline of 0.6% for the year — half of which came in the 4th quarter. Indianapolis ended 2017 with an average effective rent of $840 per unit, a 4% increase, and Columbus crossed the $900 per unit threshold in Q3 to eventually end the year at $912 per unit.
Kentucky/Tennessee/West Virginia
After briefly touching 90% average occupancy at the end of Q3, Nashville regressed 0.6% in Q4 to end 2017 at 89.1% – exactly where it started the year. Considering the Nashville market added more than 25 new properties and close to 6,000 units in 2017, flat occupancy growth for the year is not as bad as it may seem at first glance.
The remaining markets in this region all ended 2017 above 90% occupancy, with Lexington leading the way in growth at a rate of 2.4% for the year. Memphis, with its gain of about 1.5% was the only other market to see a rise, but suffered a drawback of over 1% in Q4 to arrive at that annual number. The delivery of new units appears to have negatively impacted markets such as Louisville, Chattanooga and Knoxville, as each failed to absorb the new units coming online.
Average effective rents rose across all markets in this region in 2017, but mostly at levels below the national average of 7%. The top performer was Nashville, with average effective rent per unit growing by 5.5% for the year. Lexington and Memphis joined Nashville as the only areas in the region to see both average occupancy and average effective rent rise for 2017.
Virginia/DC/Maryland
Baltimore was the only metro area in the region which failed to absorb the new delivered units, and saw a slight decrease in average occupancy to 91.7% as a result. The Greater Washington DC metro area absorbed almost 8,500 units, with just under 8,000 new units delivered for the year.
Both Norfolk and Richmond absorbed nearly 2,000 units, and occupancy in those markets rose more than 1% each to end the year at about 94%. Roanoke added about 200 units, and absorbed more than 600. This resulted in an average occupancy increase of 2.4% to end the year at 94% as well.
Average effective rents rose modestly in the Washington DC and Baltimore metro areas, with gains of about 3% and 4% respectively on a per unit basis. Richmond and Roanoke performed better, with average effective rent gains of over 5.7% and 3.2% for the year. Rents rose across the board in this region, but like most of the country in 2017, much of the gains were in the first three quarters of the year.
Mississippi/Alabama/Georgia/South Carolina/ North Carolina
The large markets in the region, such as Atlanta, Charlotte and Raleigh-Durham, all managed to absorb a sizeable number of new units to maintain occupancy levels, but not much ground was gained. Birmingham and Huntsville both showed strong absorption as well as average occupancy gains, while Mobile regressed with a 1.3% decrease due to low absorption and the delivery of more than 200 new units.
The smaller markets in Georgia performed relatively well, with Augusta experiencing a nearly 3% occupancy gain and Columbus falling just short of a 2% gain. On the other hand, Mississippi had a less than stellar 2017, with occupancies falling across the state, though the declines were modest. South Carolina, like various other areas of the country in 2017, began to show some softening due in part to new construction. Average occupancy in Charleston fell precipitously after absorbing barely one third of delivered units. Greenville/Spartanburg just managed to absorb the almost 1,400 new units delivered for a 1% occupancy gain.
Most markets in this region achieved average effective rent gains of 1-3%. Greensboro/Winston Salem, Macon, Savannah and Huntsville all surpassed 4.5% growth, but fell just short of a 5% gain. Top performers for the region like Atlanta, Wilmington and Myrtle Beach all exceeded the 5% mark for the year.
Florida
Whereas some of its neighboring states had mixed results in 2017, Florida fared pretty well across the board. The large markets like Miami-Fort Lauderdale, Orlando and Tampa all absorbed more than 4,000 net units, with Orlando crossing the 6,000-unit threshold.
Smaller markets like Fort Myers-Naples and Palm Beach punched above their weight. Fort Myers-Naples, for example, absorbed 830 units which represented 3.7% of the prior market size. Equally impressive, Palm Beach absorbed over 2,300 units – approximately 4% of the total number of units in the market. For context, Orlando absorbed units equal to 3.8% of its total units and Miami-Fort Lauderdale absorbed 3.4%.
Average effective rent growth was also healthy across Florida for the year. Markets like Orlando, Jacksonville and Pensacola saw increases between 6.5-7.5%, while the 2.7% gain for Tallahassee represents the smallest annual gain in the state.
Pennsylvania/New York/New Jersey/Delaware
New York City added more than 15,000 units in 2017, and absorbed 20,000 for a net average occupancy gain of 1.1% to 90%. Pittsburgh and State College/Altoona in Pennsylvania also experienced occupancy gains of right about 1%, while Albany was the only market in this region to lose ground in 2017. Negative absorption along with the delivery of over 600 new units in the Albany region contributed to a 2.4% occupancy drop. However, the new units resulted in an annual average rent increase of over 15%, settling on $1,170 per unit by the end of the year.
Rents also rose significantly in the State College/Altoona market to $1,243 per unit, and New York City saw rents rise close to 10% to an average effective rent of $2,500 per unit. The larger Pennsylvania markets, Philadelphia and Pittsburg, finished the year up 4% and 5% respectively. Although Philadelphia continued its upward momentum to end the year, Pittsburg gave up 0.5% in effective rent gains in Q4.
Connecticut/Rhode Island/Massachusetts/New Hampshire/Vermont/Maine
For the smaller markets in the region, the variance for occupancy gains and losses were significant. Leading the way was Hartford, with a 2.6% increase to 93.7% as a result of absorbing more than double the number of units delivered. On the low end of the scale, both Springfield and Concord finished the year with an average occupancy loss of just over 1.5% after suffering negative net absorption. Both remain more than 95% occupied however, so these were slight losses.
Due to its size, Boston had the most units delivered and the most units absorbed, but occupancy remained flat for the year at 89.6% and average effective rent grew a modest 3.4%. Springfield, Concord and Providence all had excellent average effective rent increases of more than 8%. In keeping with the theme that developed across the nation in 2017, most of the rent gains in this region occurred in the first three quarters of the year.
In general, while many markets are still performing well, we are starting to see the introduction of new units have an impact across the country. Whereas absorption was still outpacing delivery of new units nationally through the 3rd quarter, new units outpaced absorption in the 4th quarter. As a result, occupancy gains softened late in 2017, and average effective rent regressed or flattened in Q4 across a considerable number of markets.
Consequently, while overall numbers may still look good for 2017, in much of the country, the Q4 numbers present a more sobering outlook going forward. The sky isn’t falling; however, the next several quarters may not reflect the consistently positive performance that owners and managers have come to expect from years past. Hopefully a tapering of the new construction pipeline can stave off any large pricing decreases in 2018.
Ready to Expore Our Services?
Based in Dallas, Texas, ALN Apartment Data, Inc. has been researching Multifamily since 1991. We’ve built platforms to fit the specific needs of Management Companies, Brokers, Lenders, Appraisers, Owners, and Investors, along with two platforms for Supplier Partners in the industry. Contact us today to talk about our company, methodology, platforms, and pricing.